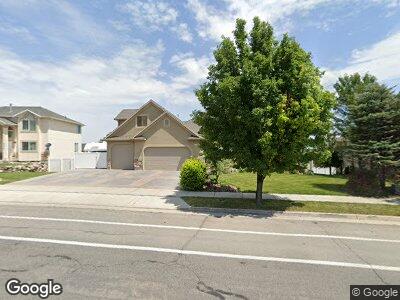
5762 W Emmeline Dr Herriman, UT 84096
Estimated Value: $818,000 - $914,000
5
Beds
5
Baths
4,294
Sq Ft
$202/Sq Ft
Est. Value
About This Home
This home is located at 5762 W Emmeline Dr, Herriman, UT 84096 and is currently estimated at $865,434, approximately $201 per square foot. 5762 W Emmeline Dr is a home located in Salt Lake County with nearby schools including Blackridge School, Fort Herriman Middle School, and Mountain Ridge High School.
Ownership History
Date
Name
Owned For
Owner Type
Purchase Details
Closed on
Mar 16, 2023
Sold by
Melissa Jolley Family Trust
Bought by
Eliason Brian and Eliason Melissa
Current Estimated Value
Home Financials for this Owner
Home Financials are based on the most recent Mortgage that was taken out on this home.
Original Mortgage
$550,000
Outstanding Balance
$535,694
Interest Rate
6.09%
Mortgage Type
New Conventional
Estimated Equity
$329,740
Purchase Details
Closed on
Apr 30, 2021
Sold by
Jolley Melissa and Landrum Ross Adrian
Bought by
Jolley Melissa and The Melissa Jolley Family Trus
Purchase Details
Closed on
Nov 20, 2020
Sold by
Jolley Melissa and Landrum Ross Adrian
Bought by
Jolley Melissa and Landrum Ross Adrian
Home Financials for this Owner
Home Financials are based on the most recent Mortgage that was taken out on this home.
Original Mortgage
$459,500
Interest Rate
2.8%
Mortgage Type
New Conventional
Purchase Details
Closed on
Oct 4, 2018
Sold by
Trewartha Melissa and Landrum Ross Adrian
Bought by
Trewartha Melissa and Landrum Ross Adrian
Home Financials for this Owner
Home Financials are based on the most recent Mortgage that was taken out on this home.
Original Mortgage
$518,000
Interest Rate
4.5%
Mortgage Type
New Conventional
Purchase Details
Closed on
Nov 2, 2011
Sold by
Potts Frances T
Bought by
Hunter Rebecca and Potts Frances T
Home Financials for this Owner
Home Financials are based on the most recent Mortgage that was taken out on this home.
Original Mortgage
$150,000
Interest Rate
3.26%
Mortgage Type
New Conventional
Purchase Details
Closed on
Jan 8, 2010
Sold by
Hunter Rebecca L and Potts Frances T
Bought by
Hunter Rebecca and Potts Frances T
Purchase Details
Closed on
Feb 28, 2005
Sold by
Hunter Rebecca L and Potts Frances T
Bought by
Hunter Rebecca L and Potts Frances T
Purchase Details
Closed on
Apr 13, 2004
Sold by
Legacy Homes & Construction Inc
Bought by
Hunter Rebecca L and Potts Frances T
Home Financials for this Owner
Home Financials are based on the most recent Mortgage that was taken out on this home.
Original Mortgage
$275,000
Interest Rate
5.57%
Mortgage Type
Purchase Money Mortgage
Purchase Details
Closed on
Oct 17, 2003
Sold by
Rosecrest Inc
Bought by
Pinnacle Management Inc and Tycksen Eric
Purchase Details
Closed on
Oct 16, 2003
Sold by
Pinnacle Management Inc
Bought by
Legacy Homes & Construction Inc
Create a Home Valuation Report for This Property
The Home Valuation Report is an in-depth analysis detailing your home's value as well as a comparison with similar homes in the area
Home Values in the Area
Average Home Value in this Area
Purchase History
| Date | Buyer | Sale Price | Title Company |
|---|---|---|---|
| Eliason Brian | -- | Steed Title | |
| Jolley Melissa | -- | None Available | |
| Jolley Melissa | -- | Title Guarantee | |
| Trewartha Melissa | -- | Accommodation | |
| Trewartha Melissa | -- | Novation Title Ins Agcy | |
| Hunter Rebecca | -- | Meridian Title | |
| Potts Frances T | -- | Meridian Title | |
| Hunter Rebecca | -- | None Available | |
| Hunter Rebecca L | -- | -- | |
| Hunter Rebecca L | -- | Integrated Title Ins Svcs | |
| Pinnacle Management Inc | -- | Metro National Title | |
| Legacy Homes & Construction Inc | -- | Integrated Title Ins Svcs |
Source: Public Records
Mortgage History
| Date | Status | Borrower | Loan Amount |
|---|---|---|---|
| Open | Eliason Brian | $550,000 | |
| Previous Owner | Jolley Melissa | $70,000 | |
| Previous Owner | Jolley Melissa | $459,500 | |
| Previous Owner | Trewartha Melissa | $462,250 | |
| Previous Owner | Trewartha Melissa | $518,000 | |
| Previous Owner | Potts Frances T | $150,000 | |
| Previous Owner | Potts Frances T | $135,000 | |
| Previous Owner | Hunter Rebecca L | $275,000 |
Source: Public Records
Tax History Compared to Growth
Tax History
| Year | Tax Paid | Tax Assessment Tax Assessment Total Assessment is a certain percentage of the fair market value that is determined by local assessors to be the total taxable value of land and additions on the property. | Land | Improvement |
|---|---|---|---|---|
| 2023 | $5,276 | $809,100 | $200,600 | $608,500 |
| 2022 | $5,398 | $826,500 | $196,700 | $629,800 |
| 2021 | $4,599 | $624,800 | $163,500 | $461,300 |
| 2020 | $4,469 | $572,300 | $149,000 | $423,300 |
| 2019 | $4,430 | $557,700 | $118,000 | $439,700 |
| 2018 | $0 | $451,200 | $114,900 | $336,300 |
| 2017 | $3,482 | $426,800 | $114,900 | $311,900 |
| 2016 | $3,264 | $398,000 | $114,900 | $283,100 |
| 2015 | $3,264 | $372,000 | $112,200 | $259,800 |
| 2014 | $3,139 | $350,400 | $106,800 | $243,600 |
Source: Public Records
Map
Nearby Homes
- 14234 S Arbor Rose Cir
- 14297 Rosaleen Ln
- 14342 S Round Rock Dr
- 5701 W Emmeline Dr
- 14456 S Steamboat Cir
- 5729 Sol Vista Cir
- 14282 Prairie Dawn Ln
- 14127 Crown Rose Dr
- 13978 S Nelson Peak Cir
- 13947 Emmeline Dr
- 13992 Sierra Glow Ln
- 5884 W Autumn Dusk Cove
- 6057 W Herriman View Way
- 14007 Sierra Glow Ln
- 14167 S Prospero Ln
- 13836 Crimson Glory Ct
- 5356 Morning Blush Dr
- 13839 Horizon Hills Cir
- 5324 W 14080 S
- 6221 W Fort Pierce Way Unit 204