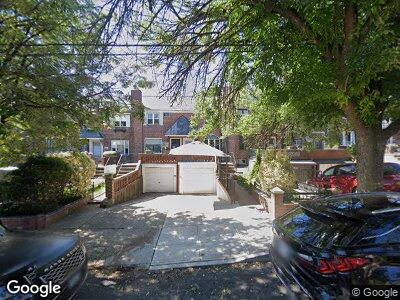
58-36 79th St Flushing, NY 11379
Maspeth NeighborhoodEstimated Value: $824,450 - $888,000
2
Beds
2
Baths
1,152
Sq Ft
$743/Sq Ft
Est. Value
About This Home
This home is located at 58-36 79th St, Flushing, NY 11379 and is currently estimated at $855,613, approximately $742 per square foot. 58-36 79th St is a home located in Queens County with nearby schools including Ps 58 School Of Heroes, IS 73 - The Frank Sansivieri School, and Newtown High School.
Ownership History
Date
Name
Owned For
Owner Type
Purchase Details
Closed on
Mar 20, 2020
Sold by
Lam Chin Cheung and % : Kaiko Chan Esq
Bought by
Kosalanan Sopon
Current Estimated Value
Home Financials for this Owner
Home Financials are based on the most recent Mortgage that was taken out on this home.
Original Mortgage
$510,400
Outstanding Balance
$458,952
Interest Rate
3.4%
Mortgage Type
Unknown
Estimated Equity
$410,593
Purchase Details
Closed on
May 15, 2002
Sold by
Benintendo Frank
Bought by
Lam Chin Cheung and Lam Chui Nei
Purchase Details
Closed on
Sep 9, 1998
Sold by
Benintendo Frank and Benintendo Patricia
Bought by
Benintendo Frank
Home Financials for this Owner
Home Financials are based on the most recent Mortgage that was taken out on this home.
Original Mortgage
$65,000
Interest Rate
9.5%
Create a Home Valuation Report for This Property
The Home Valuation Report is an in-depth analysis detailing your home's value as well as a comparison with similar homes in the area
Home Values in the Area
Average Home Value in this Area
Purchase History
| Date | Buyer | Sale Price | Title Company |
|---|---|---|---|
| Kosalanan Sopon | $690,000 | -- | |
| Kosalanan Sopon | $690,000 | -- | |
| Lam Chin Cheung | -- | -- | |
| Lam Chin Cheung | -- | -- | |
| Benintendo Frank | -- | Stewart Title Insurance Co | |
| Benintendo Frank | -- | Stewart Title Insurance Co |
Source: Public Records
Mortgage History
| Date | Status | Borrower | Loan Amount |
|---|---|---|---|
| Open | Kosalanan Sopon | $510,400 | |
| Closed | Kosalanan Sopon | $510,400 | |
| Previous Owner | Benintendo Frank | $65,000 |
Source: Public Records
Tax History Compared to Growth
Tax History
| Year | Tax Paid | Tax Assessment Tax Assessment Total Assessment is a certain percentage of the fair market value that is determined by local assessors to be the total taxable value of land and additions on the property. | Land | Improvement |
|---|---|---|---|---|
| 2024 | $7,081 | $35,254 | $10,623 | $24,631 |
| 2023 | $6,735 | $33,534 | $10,710 | $22,824 |
| 2022 | $6,351 | $45,180 | $13,740 | $31,440 |
| 2021 | $6,334 | $48,300 | $13,740 | $34,560 |
| 2020 | $6,075 | $44,100 | $13,740 | $30,360 |
| 2019 | $5,853 | $42,900 | $13,740 | $29,160 |
| 2018 | $5,399 | $27,945 | $9,116 | $18,829 |
| 2017 | $5,105 | $26,512 | $10,152 | $16,360 |
| 2016 | $4,704 | $26,512 | $10,152 | $16,360 |
| 2015 | $2,797 | $25,081 | $11,604 | $13,477 |
| 2014 | $2,797 | $24,482 | $11,537 | $12,945 |
Source: Public Records
Map
Nearby Homes
- 58-17 80th St
- 6022 77th Place
- 76-22 57th Rd
- 5810 83rd Place
- 8318 58th Ave
- 6160 81st St
- 58-22 75th St
- 6011 75th St
- 57-52 75th St
- 62-20 79th St
- 5745 74th St Unit 306
- 57-45 74th St Unit 309
- 57-10 84th St
- 62-31 79th St
- 60-37 84th St
- 5415 82nd St
- 7138 58th Rd
- 8414 Eliot Ave
- 62 W 83rd St Unit 1
- 62 W 83rd St Unit 4