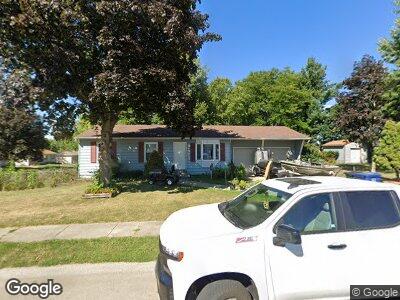
5804 N Howell St Davenport, IA 52806
North Side NeighborhoodEstimated Value: $165,000 - $179,000
3
Beds
2
Baths
1,000
Sq Ft
$172/Sq Ft
Est. Value
About This Home
This home is located at 5804 N Howell St, Davenport, IA 52806 and is currently estimated at $172,033, approximately $172 per square foot. 5804 N Howell St is a home located in Scott County with nearby schools including Harry S. Truman School, Wood Intermediate School, and North High School.
Ownership History
Date
Name
Owned For
Owner Type
Purchase Details
Closed on
Dec 12, 2023
Sold by
Williams Kurt A and Williams Laura S
Bought by
Kurt A Williams Trust and Williams
Current Estimated Value
Purchase Details
Closed on
Nov 8, 2021
Sold by
Gearhead Properties Llc
Bought by
Williams Kurt
Purchase Details
Closed on
Oct 24, 2013
Sold by
Williams Karen Lee and Williams Karen L
Bought by
Gearhead Properties Lc
Purchase Details
Closed on
Oct 25, 2010
Sold by
The Secretary Of Housing & Urban Develop
Bought by
Williams Karen Lee
Purchase Details
Closed on
Apr 27, 2010
Sold by
Wilson Mcarthur
Bought by
Us Bank Na
Purchase Details
Closed on
May 8, 2009
Sold by
Us Bank Na
Bought by
Secretary Of Housing & Urban Development
Purchase Details
Closed on
Sep 17, 2007
Sold by
Pham Tuan A and Pham Anh H
Bought by
Wilson Mcarthur and Wilson Rita
Home Financials for this Owner
Home Financials are based on the most recent Mortgage that was taken out on this home.
Original Mortgage
$121,099
Interest Rate
6.66%
Mortgage Type
FHA
Create a Home Valuation Report for This Property
The Home Valuation Report is an in-depth analysis detailing your home's value as well as a comparison with similar homes in the area
Home Values in the Area
Average Home Value in this Area
Purchase History
| Date | Buyer | Sale Price | Title Company |
|---|---|---|---|
| Kurt A Williams Trust | -- | None Listed On Document | |
| Williams Kurt | -- | None Available | |
| Gearhead Properties Lc | -- | None Available | |
| Williams Karen Lee | -- | None Available | |
| Us Bank Na | $137,395 | None Available | |
| Secretary Of Housing & Urban Development | $137,500 | None Available | |
| Wilson Mcarthur | $123,000 | None Available |
Source: Public Records
Mortgage History
| Date | Status | Borrower | Loan Amount |
|---|---|---|---|
| Previous Owner | Wilson Mcarthur | $121,099 |
Source: Public Records
Tax History Compared to Growth
Tax History
| Year | Tax Paid | Tax Assessment Tax Assessment Total Assessment is a certain percentage of the fair market value that is determined by local assessors to be the total taxable value of land and additions on the property. | Land | Improvement |
|---|---|---|---|---|
| 2024 | $3,184 | $151,720 | $26,880 | $124,840 |
| 2023 | $3,698 | $151,720 | $26,880 | $124,840 |
| 2022 | $3,304 | $132,970 | $21,840 | $111,130 |
| 2021 | $2,854 | $132,970 | $21,840 | $111,130 |
| 2020 | $3,423 | $123,140 | $21,840 | $101,300 |
| 2019 | $3,321 | $115,260 | $21,840 | $93,420 |
| 2018 | $1,064 | $115,260 | $21,840 | $93,420 |
| 2017 | $2,510 | $110,360 | $21,840 | $88,520 |
| 2016 | $2,898 | $110,360 | $0 | $0 |
| 2015 | $2,416 | $109,720 | $0 | $0 |
| 2014 | $2,436 | $109,720 | $0 | $0 |
| 2013 | $2,394 | $0 | $0 | $0 |
| 2012 | -- | $107,500 | $27,280 | $80,220 |
Source: Public Records
Map
Nearby Homes
- 1733 W 58th St
- 0000 W 53rd St
- 1740 W 55th St
- 1729 Welshire Dr
- 6411 Cedar St
- 5503 N Linwood Ave
- 15 Madison Cir
- 2616 W 56th St
- 2521 W 63rd St
- 2632 W 59th St
- 3805 Joyce Ln
- 2632 W 54th St
- 5432 Oakbrook Rd
- 1835 W 68th St
- 5833 Taylor St
- 2714 W 66th St
- 6350 High Point Ct
- 6654 N Division St
- 2824 W 66th St
- 5138 Fillmore Ct