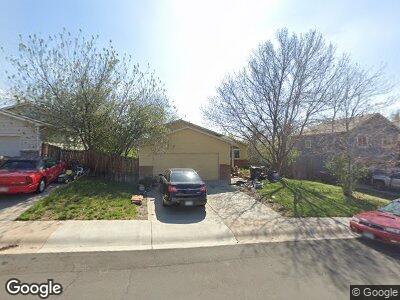
5818 Colby St Fort Collins, CO 80525
Huntington Hills NeighborhoodEstimated Value: $551,000 - $655,000
3
Beds
2
Baths
1,852
Sq Ft
$314/Sq Ft
Est. Value
About This Home
This home is located at 5818 Colby St, Fort Collins, CO 80525 and is currently estimated at $580,750, approximately $313 per square foot. 5818 Colby St is a home located in Larimer County with nearby schools including Werner Elementary School, Preston Middle School, and Fossil Ridge High School.
Ownership History
Date
Name
Owned For
Owner Type
Purchase Details
Closed on
Aug 1, 1995
Sold by
Nededog Naomi S
Bought by
Astudillo Naomi S
Current Estimated Value
Purchase Details
Closed on
Jan 1, 1994
Sold by
Rossi Michael S
Bought by
Astudillo Alejandro
Purchase Details
Closed on
Sep 1, 1993
Sold by
Huntington Hills Corp
Bought by
Rossi Michael S
Purchase Details
Closed on
Aug 1, 1993
Sold by
Huntington Hills Corp
Bought by
Rossi Michael S
Purchase Details
Closed on
Dec 1, 1992
Sold by
327006 Alberta Ltd
Bought by
Huntington Hills Corp
Purchase Details
Closed on
Nov 1, 1992
Sold by
327006 Alberta Ltd
Bought by
Huntington Hills Corp
Create a Home Valuation Report for This Property
The Home Valuation Report is an in-depth analysis detailing your home's value as well as a comparison with similar homes in the area
Home Values in the Area
Average Home Value in this Area
Purchase History
| Date | Buyer | Sale Price | Title Company |
|---|---|---|---|
| Astudillo Naomi S | -- | -- | |
| Astudillo Alejandro | $113,500 | -- | |
| Rossi Michael S | -- | -- | |
| Rossi Michael S | $17,500 | -- | |
| Huntington Hills Corp | -- | -- | |
| Huntington Hills Corp | $54,300 | -- |
Source: Public Records
Mortgage History
| Date | Status | Borrower | Loan Amount |
|---|---|---|---|
| Open | Astudillo Alejandro | $100,000 | |
| Open | Astudillo Alejandro | $157,500 | |
| Closed | Astudillo Alejandro | $153,500 | |
| Closed | Astudillo Alejandro | $15,000 | |
| Closed | Astudillo Alejandro | $172,000 | |
| Closed | Astudillo Alejandro | $43,595 | |
| Closed | Astudillo Alejandro | $30,000 | |
| Closed | Astudillo Alejandro | $172,000 | |
| Closed | Astudillo Alejandro | $50,000 | |
| Closed | Astudillo Alejandro | $117,750 | |
| Closed | Astudillo Alejandro | $7,850 | |
| Closed | Astudillo Alejandro | $29,000 |
Source: Public Records
Tax History Compared to Growth
Tax History
| Year | Tax Paid | Tax Assessment Tax Assessment Total Assessment is a certain percentage of the fair market value that is determined by local assessors to be the total taxable value of land and additions on the property. | Land | Improvement |
|---|---|---|---|---|
| 2025 | $3,054 | $36,488 | $10,519 | $25,969 |
| 2024 | $3,054 | $36,488 | $10,519 | $25,969 |
| 2022 | $2,427 | $25,173 | $3,684 | $21,489 |
| 2021 | $2,454 | $25,898 | $3,790 | $22,108 |
| 2020 | $2,701 | $28,264 | $3,790 | $24,474 |
| 2019 | $2,712 | $28,264 | $3,790 | $24,474 |
| 2018 | $2,154 | $23,126 | $3,816 | $19,310 |
| 2017 | $2,147 | $23,126 | $3,816 | $19,310 |
| 2016 | $1,844 | $19,765 | $4,219 | $15,546 |
| 2015 | $1,830 | $19,770 | $4,220 | $15,550 |
| 2014 | $1,609 | $17,260 | $4,220 | $13,040 |
Source: Public Records
Map
Nearby Homes
- 424 Dunne Dr
- 5822 Venus Ave
- 0 Mars Dr
- 538 Dunraven Dr
- 5859 Huntington Hills Dr
- 6106 Hamilton Ct
- 5620 Fossil Creek Pkwy Unit 4106
- 5620 Fossil Creek Pkwy Unit 10106
- 5620 Fossil Creek Pkwy Unit 8208
- 5620 Fossil Creek Pkwy Unit 3204
- 5620 Fossil Creek Pkwy Unit 2202
- 5413 Fossil Ct N
- 5332 Fossil Ridge Dr
- 312 Galaxy Way
- 803 Roma Valley Dr
- 6260 Buchanan St
- 517 E Trilby Rd Unit 61
- 820 Courtenay Cir
- 821 Courtenay Cir
- 801 Westbourn Ct