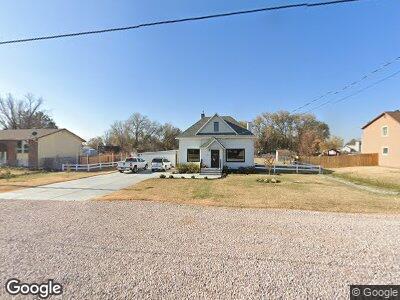
5821 S 5900 W Hooper, UT 84315
Estimated Value: $513,000 - $526,000
4
Beds
2
Baths
2,044
Sq Ft
$253/Sq Ft
Est. Value
About This Home
This home is located at 5821 S 5900 W, Hooper, UT 84315 and is currently estimated at $517,544, approximately $253 per square foot. 5821 S 5900 W is a home located in Weber County with nearby schools including Hooper School, Rocky Mountain Junior High School, and Fremont High School.
Ownership History
Date
Name
Owned For
Owner Type
Purchase Details
Closed on
Feb 7, 2024
Sold by
Lawson Keith and Lawson Suzette
Bought by
Keith And Suzette Lawson Family Trust and Lawson
Current Estimated Value
Purchase Details
Closed on
Nov 23, 2020
Sold by
Funk Matthew and Funk Dianna
Bought by
Lawson Suzette and Lawson Keith
Home Financials for this Owner
Home Financials are based on the most recent Mortgage that was taken out on this home.
Original Mortgage
$271,200
Interest Rate
2.8%
Mortgage Type
New Conventional
Purchase Details
Closed on
Jun 26, 2017
Sold by
Uhn Joseph R
Bought by
Funk Matthew and Funk Dianna
Home Financials for this Owner
Home Financials are based on the most recent Mortgage that was taken out on this home.
Original Mortgage
$242,250
Interest Rate
4.05%
Mortgage Type
New Conventional
Create a Home Valuation Report for This Property
The Home Valuation Report is an in-depth analysis detailing your home's value as well as a comparison with similar homes in the area
Home Values in the Area
Average Home Value in this Area
Purchase History
| Date | Buyer | Sale Price | Title Company |
|---|---|---|---|
| Keith And Suzette Lawson Family Trust | -- | None Listed On Document | |
| Lawson Suzette | -- | First American Union Heights | |
| Funk Matthew | -- | Lincoln Title Ins Agency |
Source: Public Records
Mortgage History
| Date | Status | Borrower | Loan Amount |
|---|---|---|---|
| Previous Owner | Lawson Suzette | $19,962 | |
| Previous Owner | Lawson Suzette | $271,200 | |
| Previous Owner | Funk Matthew | $237,500 | |
| Previous Owner | Funk Matthew | $242,250 |
Source: Public Records
Tax History Compared to Growth
Tax History
| Year | Tax Paid | Tax Assessment Tax Assessment Total Assessment is a certain percentage of the fair market value that is determined by local assessors to be the total taxable value of land and additions on the property. | Land | Improvement |
|---|---|---|---|---|
| 2024 | $2,399 | $234,299 | $98,144 | $136,155 |
| 2023 | $2,341 | $226,600 | $98,360 | $128,240 |
| 2022 | $2,217 | $219,450 | $76,424 | $143,026 |
| 2021 | $1,972 | $329,000 | $114,192 | $214,808 |
| 2020 | $1,864 | $285,000 | $79,431 | $205,569 |
| 2019 | $1,778 | $257,000 | $59,344 | $197,656 |
| 2018 | $1,628 | $225,000 | $56,340 | $168,660 |
| 2017 | $1,240 | $166,000 | $56,266 | $109,734 |
| 2016 | $1,069 | $77,295 | $27,150 | $50,145 |
| 2015 | $1,159 | $82,538 | $27,150 | $55,388 |
| 2014 | $888 | $61,508 | $35,361 | $26,147 |
Source: Public Records
Map
Nearby Homes