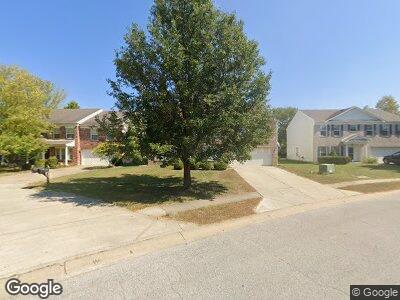
5843 Amber Ln Indianapolis, IN 46234
Estimated Value: $348,458 - $398,000
5
Beds
3
Baths
4,064
Sq Ft
$90/Sq Ft
Est. Value
About This Home
This home is located at 5843 Amber Ln, Indianapolis, IN 46234 and is currently estimated at $365,865, approximately $90 per square foot. 5843 Amber Ln is a home located in Hendricks County with nearby schools including Delaware Trail Elementary School, Brownsburg East Middle School, and Brownsburg High School.
Ownership History
Date
Name
Owned For
Owner Type
Purchase Details
Closed on
Sep 7, 2022
Sold by
Harbhajan Aulakh
Bought by
Oceanside Properties Llc
Current Estimated Value
Home Financials for this Owner
Home Financials are based on the most recent Mortgage that was taken out on this home.
Original Mortgage
$139,000
Outstanding Balance
$133,980
Interest Rate
5.54%
Mortgage Type
New Conventional
Estimated Equity
$231,885
Purchase Details
Closed on
Sep 16, 2021
Sold by
Hendricks County Sheriff
Bought by
Village Capital & Investment Llc
Purchase Details
Closed on
Nov 2, 2009
Sold by
Ledell Dalayna
Bought by
Ledell Dalayna and Diggins Brishawnda
Home Financials for this Owner
Home Financials are based on the most recent Mortgage that was taken out on this home.
Original Mortgage
$194,139
Interest Rate
4.96%
Mortgage Type
FHA
Create a Home Valuation Report for This Property
The Home Valuation Report is an in-depth analysis detailing your home's value as well as a comparison with similar homes in the area
Home Values in the Area
Average Home Value in this Area
Purchase History
| Date | Buyer | Sale Price | Title Company |
|---|---|---|---|
| Oceanside Properties Llc | -- | -- | |
| Village Capital & Investment Llc | $311,013 | None Available | |
| Ledell Dalayna | -- | Legacy Title & Escrow Servic |
Source: Public Records
Mortgage History
| Date | Status | Borrower | Loan Amount |
|---|---|---|---|
| Open | Aulakh Harbhajan | $139,000 | |
| Previous Owner | Aulakh Harbhajan | $304,000 | |
| Previous Owner | Ledell Dalayna | $55,222 | |
| Previous Owner | Ledell Dalayna | $189,364 | |
| Previous Owner | Ledell Dalayna | $194,139 | |
| Previous Owner | Ledell Dalanya J | $158,075 |
Source: Public Records
Tax History Compared to Growth
Tax History
| Year | Tax Paid | Tax Assessment Tax Assessment Total Assessment is a certain percentage of the fair market value that is determined by local assessors to be the total taxable value of land and additions on the property. | Land | Improvement |
|---|---|---|---|---|
| 2024 | $6,606 | $330,300 | $48,900 | $281,400 |
| 2023 | $5,664 | $283,200 | $41,300 | $241,900 |
| 2022 | $2,722 | $272,200 | $39,400 | $232,800 |
| 2021 | $2,542 | $254,200 | $39,400 | $214,800 |
| 2020 | $2,399 | $239,900 | $39,400 | $200,500 |
| 2019 | $2,377 | $237,700 | $38,600 | $199,100 |
| 2018 | $2,285 | $228,500 | $38,600 | $189,900 |
| 2017 | $2,151 | $215,100 | $35,900 | $179,200 |
| 2016 | $2,079 | $207,900 | $35,900 | $172,000 |
| 2014 | $1,892 | $189,200 | $33,700 | $155,500 |
Source: Public Records
Map
Nearby Homes
- 10370 Splendor Way
- 5701 Brookstone Dr
- 10349 Gateway Dr
- 10689 Brooks St
- 10329 Gateway Dr
- 6034 Bluecrest Dr
- 5772 Jamestown Square Ln
- 5782 Jamestown Square Ln
- 6059 Bluecrest Dr
- 10629 Medinah Dr Unit 1
- 5869 Jamestown Square Ln
- 10342 Split Rock Way
- 5650 Goodwin St
- 10072 Graceful Landing Dr
- 5895 Noble Dr
- 5524 Goodwin St
- 5815 Noble Dr
- 5565 Noble Dr
- 5845 Skyward Ln
- 5924 Skyward Ln