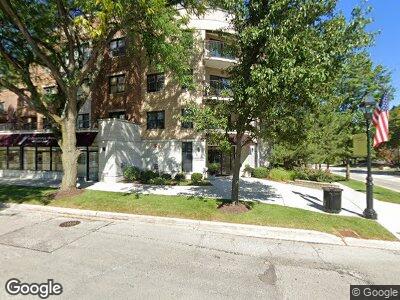
586 Crescent Blvd Unit 401 Glen Ellyn, IL 60137
Estimated Value: $702,725 - $757,000
3
Beds
2
Baths
2,145
Sq Ft
$346/Sq Ft
Est. Value
About This Home
This home is located at 586 Crescent Blvd Unit 401, Glen Ellyn, IL 60137 and is currently estimated at $741,431, approximately $345 per square foot. 586 Crescent Blvd Unit 401 is a home located in DuPage County with nearby schools including Forest Glen Elementary School, Hadley Junior High School, and Glenbard West High School.
Ownership History
Date
Name
Owned For
Owner Type
Purchase Details
Closed on
Feb 10, 2025
Sold by
Manak Revocable Trust and Manak Thomas J
Bought by
Thomas J Manak Trust and Manak
Current Estimated Value
Purchase Details
Closed on
Aug 27, 2019
Sold by
Manak Thomas J and Manak Rosemary A
Bought by
Manak Thomas J and Manak Rosemary A
Purchase Details
Closed on
Jul 18, 2003
Sold by
Rtg Crescent Station Llc
Bought by
Manak Thomas J and Manak Rosemary A
Home Financials for this Owner
Home Financials are based on the most recent Mortgage that was taken out on this home.
Original Mortgage
$322,700
Interest Rate
6.4%
Mortgage Type
Purchase Money Mortgage
Create a Home Valuation Report for This Property
The Home Valuation Report is an in-depth analysis detailing your home's value as well as a comparison with similar homes in the area
Home Values in the Area
Average Home Value in this Area
Purchase History
| Date | Buyer | Sale Price | Title Company |
|---|---|---|---|
| Thomas J Manak Trust | -- | None Listed On Document | |
| Manak Thomas J | -- | Attorney | |
| Manak Thomas J | $506,500 | Git |
Source: Public Records
Mortgage History
| Date | Status | Borrower | Loan Amount |
|---|---|---|---|
| Previous Owner | Manak Thomas J | $236,250 | |
| Previous Owner | Manak Rosemary A | $237,000 | |
| Previous Owner | Manak Thomas J | $73,000 | |
| Previous Owner | Manak Thomas J | $278,657 | |
| Previous Owner | Manak Thomas J | $100,000 | |
| Previous Owner | Manak Thomas J | $322,700 |
Source: Public Records
Tax History Compared to Growth
Tax History
| Year | Tax Paid | Tax Assessment Tax Assessment Total Assessment is a certain percentage of the fair market value that is determined by local assessors to be the total taxable value of land and additions on the property. | Land | Improvement |
|---|---|---|---|---|
| 2023 | $11,320 | $168,050 | $18,730 | $149,320 |
| 2022 | $12,741 | $181,170 | $6,770 | $174,400 |
| 2021 | $12,246 | $176,870 | $6,610 | $170,260 |
| 2020 | $12,001 | $175,220 | $6,550 | $168,670 |
| 2019 | $11,724 | $170,600 | $6,380 | $164,220 |
| 2018 | $11,088 | $160,730 | $6,010 | $154,720 |
| 2017 | $11,288 | $154,800 | $5,790 | $149,010 |
| 2016 | $11,440 | $148,620 | $5,560 | $143,060 |
| 2015 | $11,414 | $141,780 | $5,300 | $136,480 |
| 2014 | $11,756 | $140,790 | $5,260 | $135,530 |
| 2013 | $11,446 | $141,220 | $5,280 | $135,940 |
Source: Public Records
Map
Nearby Homes
- 570 Crescent Blvd Unit 409
- 501 Forest Ave Unit 205
- 445 N Park Blvd Unit 4B
- 445 N Park Blvd Unit 3D
- 445 N Park Blvd Unit 2B
- 445 N Park Blvd Unit 3F
- 468 Pennsylvania Ave Unit E
- 373 Forest Ave
- 451 Duane St
- 481 Duane Terrace Unit B2
- 367 N Park Blvd
- 546 Taylor Ave
- 393 Duane St Unit 304
- 504 Carleton Ave
- 355 Duane St
- 504 Newton Ave
- 439 Bryant Ave
- 734 Highview Ave
- 310 Duane St
- 844 Duane St