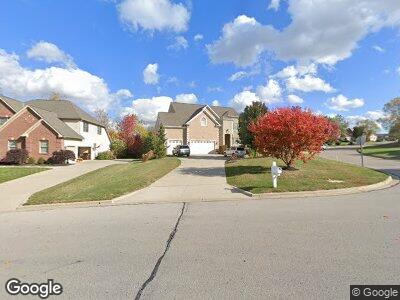
5867 Highland Hills Dr Westerville, OH 43082
Genoa NeighborhoodEstimated Value: $757,802 - $829,000
5
Beds
5
Baths
5,286
Sq Ft
$152/Sq Ft
Est. Value
About This Home
This home is located at 5867 Highland Hills Dr, Westerville, OH 43082 and is currently estimated at $804,701, approximately $152 per square foot. 5867 Highland Hills Dr is a home located in Delaware County with nearby schools including Walnut Creek Elementary School, Berkshire Middle School, and Orange High School.
Ownership History
Date
Name
Owned For
Owner Type
Purchase Details
Closed on
Jan 24, 2007
Sold by
Cortlan Homes Llc
Bought by
Fuqua David L
Current Estimated Value
Home Financials for this Owner
Home Financials are based on the most recent Mortgage that was taken out on this home.
Original Mortgage
$283,000
Interest Rate
6.19%
Mortgage Type
Purchase Money Mortgage
Purchase Details
Closed on
Mar 15, 2005
Sold by
Daneman Sara J
Bought by
Cortland Builders Llc
Home Financials for this Owner
Home Financials are based on the most recent Mortgage that was taken out on this home.
Original Mortgage
$416,000
Interest Rate
6.06%
Mortgage Type
Construction
Purchase Details
Closed on
Sep 22, 2003
Sold by
Planned Communities Inc
Bought by
Jtl Construction Inc
Create a Home Valuation Report for This Property
The Home Valuation Report is an in-depth analysis detailing your home's value as well as a comparison with similar homes in the area
Home Values in the Area
Average Home Value in this Area
Purchase History
| Date | Buyer | Sale Price | Title Company |
|---|---|---|---|
| Fuqua David L | $478,000 | Stewart Title | |
| Cortland Builders Llc | $92,000 | Stewart Title Agency Of Colu | |
| Jtl Construction Inc | $69,600 | Stewart Title |
Source: Public Records
Mortgage History
| Date | Status | Borrower | Loan Amount |
|---|---|---|---|
| Open | Fuqua David L | $194,660 | |
| Closed | Fuqua David L | $356,000 | |
| Closed | Fuqua David L | $100,000 | |
| Closed | Fuqua David L | $283,000 | |
| Previous Owner | Cortlan Homes Llc | $416,000 |
Source: Public Records
Tax History Compared to Growth
Tax History
| Year | Tax Paid | Tax Assessment Tax Assessment Total Assessment is a certain percentage of the fair market value that is determined by local assessors to be the total taxable value of land and additions on the property. | Land | Improvement |
|---|---|---|---|---|
| 2024 | $12,568 | $218,370 | $41,300 | $177,070 |
| 2023 | $12,517 | $218,370 | $41,300 | $177,070 |
| 2022 | $13,282 | $183,330 | $31,500 | $151,830 |
| 2021 | $13,363 | $183,330 | $31,500 | $151,830 |
| 2020 | $13,412 | $183,330 | $31,500 | $151,830 |
| 2019 | $11,590 | $163,520 | $31,500 | $132,020 |
| 2018 | $11,470 | $163,520 | $31,500 | $132,020 |
| 2017 | $10,795 | $154,140 | $27,160 | $126,980 |
| 2016 | $11,387 | $154,140 | $27,160 | $126,980 |
| 2015 | $10,370 | $154,140 | $27,160 | $126,980 |
| 2014 | $10,252 | $154,140 | $27,160 | $126,980 |
| 2013 | $10,404 | $154,140 | $27,160 | $126,980 |
Source: Public Records
Map
Nearby Homes
- 5866 Highland Hills Dr
- 5432 Willow Bend Ct
- 4875 Royal County Down
- 6016 Tournament Dr
- 4790 Sanctuary Dr
- 5731 Salem Dr
- 5194 Augusta Dr
- 6076 Victory Ln
- 5650 Somerset Ave
- 6015 Braymoore Dr
- 5615 Meadowood Ln
- 5350 Meadowood Ln
- 5090 Oakmont Place
- 5653 Shiloh Spring Dr
- 5429 Langwell Dr Unit 5429
- 5505 Via Alvito Dr
- 6422 Braymoore Dr
- 6146 Fox Hollow Dr
- 6536 Wesley Way Unit 34
- 5389 Ketterington Ln