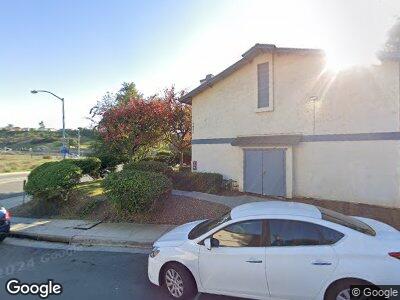
5885 Reo Terrace Unit C San Diego, CA 92139
Paradise Hills NeighborhoodEstimated Value: $544,000 - $598,000
3
Beds
3
Baths
1,344
Sq Ft
$425/Sq Ft
Est. Value
About This Home
This home is located at 5885 Reo Terrace Unit C, San Diego, CA 92139 and is currently estimated at $570,818, approximately $424 per square foot. 5885 Reo Terrace Unit C is a home located in San Diego County with nearby schools including Bell Middle School, Morse High School, and Faithful Ambassadors Bible Baptist Academy.
Ownership History
Date
Name
Owned For
Owner Type
Purchase Details
Closed on
May 16, 2022
Sold by
Evangelina Reynoso
Bought by
Evangelina Reynoso Living Trust
Current Estimated Value
Purchase Details
Closed on
Feb 28, 2000
Sold by
Gutierrez Evangelina R and Gutierrez Evangelina
Bought by
Gutierrez Evangeline Reynoso
Home Financials for this Owner
Home Financials are based on the most recent Mortgage that was taken out on this home.
Original Mortgage
$85,400
Interest Rate
8.26%
Mortgage Type
Purchase Money Mortgage
Purchase Details
Closed on
Mar 13, 1999
Sold by
Gutierrez Victor
Bought by
Gutierrez Evangelina Reynoso
Purchase Details
Closed on
Sep 3, 1997
Sold by
Karen Vandusen
Bought by
Gutierrez Victor and Gutierrez Evangelina
Home Financials for this Owner
Home Financials are based on the most recent Mortgage that was taken out on this home.
Original Mortgage
$83,922
Interest Rate
7.44%
Mortgage Type
FHA
Create a Home Valuation Report for This Property
The Home Valuation Report is an in-depth analysis detailing your home's value as well as a comparison with similar homes in the area
Home Values in the Area
Average Home Value in this Area
Purchase History
| Date | Buyer | Sale Price | Title Company |
|---|---|---|---|
| Evangelina Reynoso Living Trust | -- | Zepeda Livier C | |
| Gutierrez Evangelina Reynoso | -- | -- | |
| Gutierrez Victor | $86,500 | United Title Company |
Source: Public Records
Mortgage History
| Date | Status | Borrower | Loan Amount |
|---|---|---|---|
| Previous Owner | Gutierrez Evangelina Reynoso | $117,000 | |
| Previous Owner | Gutierrez Evangelina Reynoso | $107,500 | |
| Previous Owner | Gutierrez Evangeline Reynoso | $85,400 | |
| Previous Owner | Gutierrez Victor | $83,922 |
Source: Public Records
Tax History Compared to Growth
Tax History
| Year | Tax Paid | Tax Assessment Tax Assessment Total Assessment is a certain percentage of the fair market value that is determined by local assessors to be the total taxable value of land and additions on the property. | Land | Improvement |
|---|---|---|---|---|
| 2024 | $1,695 | $135,380 | $40,044 | $95,336 |
| 2023 | $1,657 | $132,726 | $39,259 | $93,467 |
| 2022 | $1,613 | $130,125 | $38,490 | $91,635 |
| 2021 | $1,602 | $127,575 | $37,736 | $89,839 |
| 2020 | $1,583 | $126,268 | $37,350 | $88,918 |
| 2019 | $1,555 | $123,793 | $36,618 | $87,175 |
| 2018 | $1,456 | $121,366 | $35,900 | $85,466 |
| 2017 | $1,421 | $118,988 | $35,197 | $83,791 |
| 2016 | $1,398 | $116,656 | $34,507 | $82,149 |
| 2015 | $1,378 | $114,905 | $33,989 | $80,916 |
| 2014 | $1,357 | $112,655 | $33,324 | $79,331 |
Source: Public Records
Map
Nearby Homes
- 5875 Reo Terrace Unit C
- 3115 Mount Miguel Dr
- 3129 Calle Abajo Unit spc 181
- 3129 Calle Abajo Unit 107
- 3129 Calle Abajo Unit SPC 152
- 2862 Callejon
- 3131 Valley Rd Unit 17
- 3131 Valley Rd
- 3228 Menard St
- 6105 Parkside Ave
- 3414 Fairlomas Rd Unit 32
- 3219 Alta Dr
- 3925 Kaplan Way
- 2933 Demeter Way
- 3923 Kaplan Way
- 2621 Sweetwater Rd Unit 74
- 4209 Paseo de Paz
- 0 Ridgeway Dr Unit PTP2501261
- 6044 Roanoke St
- 6274 Chadwick Ave