NOT LISTED FOR SALE

5892 Silver Oaks Dr Chino, CA 91710

Estimated Value: $790,000 - $858,000

4 Beds
3 Baths
2,335 Sq Ft
$349/Sq Ft Est. Value

Last Sold July 02, 2018

Last sale price $552,888 $237 Per Sq Ft

Est. 48% increase in value since last sale

Current estimated payment $5,114/month

About This Home

As of July 2018

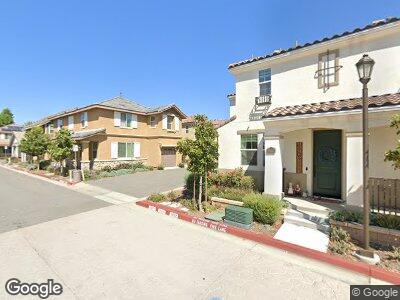
Beautiful Brand New home in Oak Grove located in Chino California, a thriving community in the southwestern part of San Bernardino County. The Ontario International Airport as well as the areas’ many employment centers are within easy access via the nearby (71) and (60) freeways
House has a living area of Approx. 2,335 Sq. Ft with Four Bedrooms, 3 Baths. First Floor has a Bedroom & Bath, the Dining Area Open Kitchen with a island. Upstair has a Loft, Tech Area and its own laundry room and a front Covered Porch. Close by to Chaffey college, Cal Poly Pomona and Ontario airport.

Ownership History

Date Name Owned For Owner Type

Purchase Details

Listed on
Jul 3, 2018
Closed on
Jun 18, 2018
Sold by
Chino Oaks Ave 23 Llc
Bought by
A & J Re Investment Llc
Seller's Agent
Oliver Yang
Cubemax International Corp.
Buyer's Agent
Jonathan Yang
Cubemax International Corp.
Sold Price
$2,500
Current Estimated Value
$815,713

Home Financials for this Owner

Home Financials are based on the most recent Mortgage that was taken out on this home.
Estimated Appreciation
$813,213
Avg. Annual Appreciation
6.29%

Range of Values:

Collateral Analytics

Collateral Analytics Collateral Analytics AVMs (Automated Valuation Model) employ a number of statistical approaches combined with neighborhood-specific comparable selection guarantees the most up-to-date and precise valuations.

Not Available

Collateral Analytics does not have data for the current month. Please view the chart for historical values.

ICE

ICE Mortgage Technology ICE Mortgage Technology’s AVM (Automated Valuation Model) is a state-of-the-art online residential property valuation tool that provides a quick and accurate estimate of the value of almost any home in the U.S.

Not Available

ICE Mortgage Technology does not have data for the current month. Please view the chart for historical values.

First American

First American First American Data & Analytics’ next-generation AVM combines unrivaled data assets with a blended ensemble of valuation models to produce highly accurate, reliable valuations you can trust.

Not Available

First American does not have data for the current month. Please view the chart for historical values.

Quantarium

Quantarium Quantarium’s valuation service, repeatedly proven the industry’s most accurate and comprehensive, is supercharged with a self-learning and auto-tuning AI engine that continually becomes smarter and more accurate as it processes daily inputs from the industry’s leading RE data lake.

Not Available

Quantarium does not have data for the current month. Please view the chart for historical values.

Average Value
Not Available
List Price
Sold Price
Create a Home Valuation Report for This Property
The Home Valuation Report is an in-depth analysis detailing your home's value as well as a comparison with similar homes in the area

Home Values in the Area

Source: Public Records

Average Home Value in this Area


Source: Public Records

Purchase History

Date Buyer Sale Price Title Company
A & J Re Investment Llc $553,000 Fidelity National Title Grou
Source: Public Records

Property History

Date Event Price Change Sq Ft Price
08/01/2018 08/01/18 Rented $2,500 0.0% --
07/03/2018 07/03/18 For Rent $2,500 0.0% --
07/02/2018 07/02/18 Sold $552,888 -1.8% $237 / Sq Ft
05/11/2018 05/11/18 For Sale $562,888 -- $241 / Sq Ft

Tax History Compared to Growth

Source: Public Records

Tax History

Year Tax Paid Tax Assessment Tax Assessment Total Assessment is a certain percentage of the fair market value that is determined by local assessors to be the total taxable value of land and additions on the property. Land Improvement
2024 $6,838 $616,883 $217,527 $399,356
2023 $6,649 $604,787 $213,262 $391,525
2022 $6,609 $592,928 $209,080 $383,848
2021 $6,479 $581,302 $204,980 $376,322
2020 $6,383 $575,341 $202,878 $372,463
2019 $6,271 $564,060 $198,900 $365,160
Source: Public Records

Agents Affiliated with this Home

  • Section Image
  • Section Image
  • Section Image
See All Agents

Map