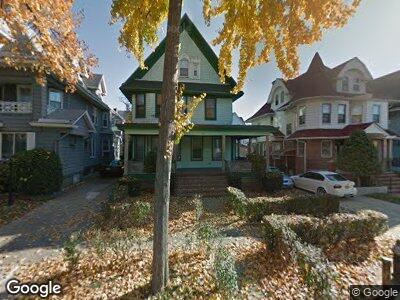
59 Rugby Rd Brooklyn, NY 11226
Prospect Park South NeighborhoodEstimated Value: $2,058,266 - $2,972,000
6
Beds
2
Baths
2,692
Sq Ft
$874/Sq Ft
Est. Value
About This Home
This home is located at 59 Rugby Rd, Brooklyn, NY 11226 and is currently estimated at $2,351,567, approximately $873 per square foot. 59 Rugby Rd is a home located in Kings County with nearby schools including P.S. 249 - The Caton and Yeshivat Shaare Torah Girls Elementary School.
Ownership History
Date
Name
Owned For
Owner Type
Purchase Details
Closed on
Sep 23, 2003
Sold by
Wilson Ana C and Wilson Antonietta A
Bought by
Wilson Ana C and Wilson Iris D
Current Estimated Value
Home Financials for this Owner
Home Financials are based on the most recent Mortgage that was taken out on this home.
Original Mortgage
$30,000
Interest Rate
6.35%
Purchase Details
Closed on
Mar 26, 2003
Sold by
Wilson Ana C and Wilson Antonietta A
Bought by
Wilson Ana C and Wilson Iris D
Home Financials for this Owner
Home Financials are based on the most recent Mortgage that was taken out on this home.
Original Mortgage
$256,200
Interest Rate
5.6%
Mortgage Type
Purchase Money Mortgage
Purchase Details
Closed on
Feb 28, 1995
Sold by
Loewenstein Ruth H
Bought by
Wilson Ana C and Wilson Antonietta A
Home Financials for this Owner
Home Financials are based on the most recent Mortgage that was taken out on this home.
Original Mortgage
$171,000
Interest Rate
8.8%
Create a Home Valuation Report for This Property
The Home Valuation Report is an in-depth analysis detailing your home's value as well as a comparison with similar homes in the area
Home Values in the Area
Average Home Value in this Area
Purchase History
| Date | Buyer | Sale Price | Title Company |
|---|---|---|---|
| Wilson Ana C | -- | -- | |
| Wilson Ana C | -- | -- | |
| Wilson Ana C | $180,000 | -- |
Source: Public Records
Mortgage History
| Date | Status | Borrower | Loan Amount |
|---|---|---|---|
| Open | Wilson Ana | $55,000 | |
| Closed | Wilson Ana C | $40,000 | |
| Open | Wilson Ana C | $359,600 | |
| Previous Owner | Wilson Ana C | $30,000 | |
| Previous Owner | Wilson Ana C | $263,700 | |
| Previous Owner | Wilson Ana C | $256,200 | |
| Previous Owner | Wilson Ana C | $60,000 | |
| Previous Owner | Wilson Ana C | $171,000 | |
| Closed | Wilson Ana C | $159,512 |
Source: Public Records
Tax History Compared to Growth
Tax History
| Year | Tax Paid | Tax Assessment Tax Assessment Total Assessment is a certain percentage of the fair market value that is determined by local assessors to be the total taxable value of land and additions on the property. | Land | Improvement |
|---|---|---|---|---|
| 2024 | $10,171 | $145,620 | $31,740 | $113,880 |
| 2023 | $9,856 | $152,460 | $31,740 | $120,720 |
| 2022 | $9,140 | $134,760 | $31,740 | $103,020 |
| 2021 | $9,635 | $128,220 | $31,740 | $96,480 |
| 2020 | $4,679 | $137,760 | $31,740 | $106,020 |
| 2019 | $8,169 | $152,340 | $31,740 | $120,600 |
| 2018 | $3,463 | $40,440 | $9,987 | $30,453 |
| 2017 | $3,243 | $38,154 | $12,638 | $25,516 |
| 2016 | $3,193 | $38,154 | $14,114 | $24,040 |
| 2015 | $1,732 | $37,275 | $18,234 | $19,041 |
| 2014 | $1,732 | $35,167 | $20,637 | $14,530 |
Source: Public Records
Map
Nearby Homes
- 39 Argyle Rd Unit 3C
- 39 Argyle Rd Unit 3B
- 39 Argyle Rd Unit 3 D
- 39 Argyle Rd Unit 3 A
- 39 Argyle Rd Unit 1 B
- 39 Argyle Rd Unit 4C
- 39 Argyle Rd Unit 1A
- 39 Argyle Rd Unit 2A
- 39 Argyle Rd Unit 2 C
- 39 Argyle Rd Unit 4B
- 39 Argyle Rd Unit 2 D
- 45 Argyle Rd Unit 3 C
- 116 Buckingham Rd
- 1409 Albemarle Rd Unit 1H
- 25 Stratford Rd Unit A1
- 1109 Church Ave
- 1701 Albemarle Rd Unit A10
- 1701 Albemarle Rd Unit C15
- 1701 Albemarle Rd Unit D2
- 68 Stratford Rd Unit 1