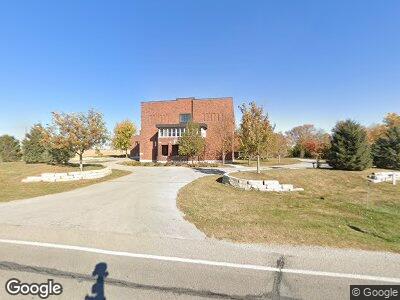
59035 190th St Nevada, IA 50201
Estimated Value: $555,000 - $873,000
--
Bed
9
Baths
13,872
Sq Ft
$50/Sq Ft
Est. Value
About This Home
This home is located at 59035 190th St, Nevada, IA 50201 and is currently estimated at $690,352, approximately $49 per square foot. 59035 190th St is a home located in Story County with nearby schools including Central Elementary School, Nevada Middle School, and Nevada High School.
Ownership History
Date
Name
Owned For
Owner Type
Purchase Details
Closed on
Jul 7, 2024
Sold by
Milford School Llc
Bought by
Boersma Josh and Boersma Mollie
Current Estimated Value
Purchase Details
Closed on
Aug 6, 2018
Sold by
Rasmussen Joel C
Bought by
Milford School Llc
Purchase Details
Closed on
May 16, 2018
Sold by
Kurto Inc
Bought by
Wifler Michael and Wifler Laura
Purchase Details
Closed on
May 15, 2018
Sold by
Kurtco Inc
Bought by
Wifler Michael and Wifler Laura
Purchase Details
Closed on
May 17, 2007
Sold by
Kelley James
Bought by
Milford School Llc
Create a Home Valuation Report for This Property
The Home Valuation Report is an in-depth analysis detailing your home's value as well as a comparison with similar homes in the area
Home Values in the Area
Average Home Value in this Area
Purchase History
| Date | Buyer | Sale Price | Title Company |
|---|---|---|---|
| Boersma Josh | $650,000 | None Listed On Document | |
| Milford School Llc | $105,000 | -- | |
| Wifler Michael | -- | -- | |
| Wifler Michael | $100,000 | -- | |
| Milford School Llc | $27,000 | -- |
Source: Public Records
Tax History Compared to Growth
Tax History
| Year | Tax Paid | Tax Assessment Tax Assessment Total Assessment is a certain percentage of the fair market value that is determined by local assessors to be the total taxable value of land and additions on the property. | Land | Improvement |
|---|---|---|---|---|
| 2024 | $7,008 | $628,700 | $155,800 | $472,900 |
| 2023 | $6,278 | $628,700 | $155,800 | $472,900 |
| 2022 | $6,180 | $455,500 | $116,000 | $339,500 |
| 2021 | $6,228 | $455,500 | $116,000 | $339,500 |
| 2020 | $6,084 | $426,500 | $87,000 | $339,500 |
| 2019 | $6,084 | $435,900 | $87,000 | $348,900 |
| 2018 | $6,035 | $386,900 | $75,100 | $311,800 |
| 2017 | $6,028 | $386,900 | $75,100 | $311,800 |
| 2016 | $5,326 | $356,700 | $75,100 | $281,600 |
| 2015 | $5,326 | $345,500 | $63,900 | $281,600 |
| 2014 | $5,430 | $345,500 | $63,900 | $281,600 |
Source: Public Records
Map
Nearby Homes