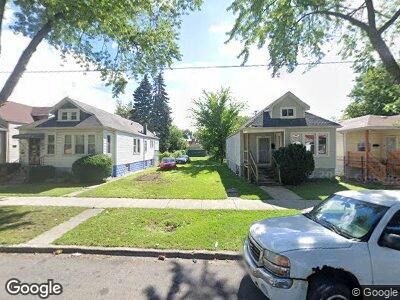
5921 S Laflin St Chicago, IL 60636
Englewood NeighborhoodEstimated Value: $335,000
--
Bed
1
Bath
--
Sq Ft
0.8
Acres
About This Home
This home is located at 5921 S Laflin St, Chicago, IL 60636 and is currently estimated at $335,000. 5921 S Laflin St is a home located in Cook County with nearby schools including A. Langford Elementary School, CICS Basil, and Providence-Englewood Elementary Charter School.
Ownership History
Date
Name
Owned For
Owner Type
Purchase Details
Closed on
Dec 28, 2011
Sold by
Z Financial Illinois G Properties Llc
Bought by
Goldmine Investments Llc
Current Estimated Value
Purchase Details
Closed on
Nov 15, 2005
Sold by
Orr David D
Bought by
Z Financial Illinois G Properties Llc
Purchase Details
Closed on
Feb 20, 2000
Sold by
Vanderbilt Mtg & Finance Inc
Bought by
Baker Hasan
Home Financials for this Owner
Home Financials are based on the most recent Mortgage that was taken out on this home.
Original Mortgage
$56,000
Interest Rate
7.18%
Mortgage Type
Seller Take Back
Purchase Details
Closed on
Jan 20, 2000
Sold by
Hare Kenneth
Bought by
Vanderbilt Mtg & Finance Inc
Home Financials for this Owner
Home Financials are based on the most recent Mortgage that was taken out on this home.
Original Mortgage
$56,000
Interest Rate
7.18%
Mortgage Type
Seller Take Back
Purchase Details
Closed on
Jun 4, 1998
Sold by
Mead Laverne
Bought by
Hare Kenneth
Create a Home Valuation Report for This Property
The Home Valuation Report is an in-depth analysis detailing your home's value as well as a comparison with similar homes in the area
Home Values in the Area
Average Home Value in this Area
Purchase History
| Date | Buyer | Sale Price | Title Company |
|---|---|---|---|
| Goldmine Investments Llc | -- | None Available | |
| Z Financial Illinois G Properties Llc | -- | None Available | |
| Baker Hasan | $46,000 | -- | |
| Vanderbilt Mtg & Finance Inc | -- | -- | |
| Hare Kenneth | -- | Chicago Title Insurance Co |
Source: Public Records
Mortgage History
| Date | Status | Borrower | Loan Amount |
|---|---|---|---|
| Previous Owner | Baker Hasan | $56,000 |
Source: Public Records
Tax History Compared to Growth
Tax History
| Year | Tax Paid | Tax Assessment Tax Assessment Total Assessment is a certain percentage of the fair market value that is determined by local assessors to be the total taxable value of land and additions on the property. | Land | Improvement |
|---|---|---|---|---|
| 2024 | $360 | $1,050 | $1,050 | -- |
| 2023 | $360 | $1,750 | $1,750 | -- |
| 2022 | $360 | $1,750 | $1,750 | $0 |
| 2021 | $352 | $1,750 | $1,750 | $0 |
| 2020 | $585 | $2,625 | $2,625 | $0 |
| 2019 | $527 | $2,625 | $2,625 | $0 |
| 2018 | $519 | $2,625 | $2,625 | $0 |
| 2017 | $490 | $2,275 | $2,275 | $0 |
| 2016 | $456 | $2,275 | $2,275 | $0 |
| 2015 | $417 | $2,275 | $2,275 | $0 |
| 2014 | $390 | $2,100 | $2,100 | $0 |
| 2013 | $382 | $2,100 | $2,100 | $0 |
Source: Public Records
Map
Nearby Homes
- 5950 S Laflin St
- 5939 S Justine St
- 5939 S Loomis Blvd
- 5814 S Laflin St
- 6020 S Loomis Blvd
- 6006 S Ashland Ave
- 5748 S Laflin St
- 5747 S Laflin St
- 5749 S Bishop St
- 5946 S Throop St
- 6101 S Ashland Ave
- 5723 S Laflin St
- 5949 S Paulina St
- 5731 S Loomis Blvd
- 5738 S Ada St
- 5734 S Ada St
- 5711 S Laflin St
- 5734 S Ashland Ave
- 5706 S Bishop St
- 6132 S Justine St