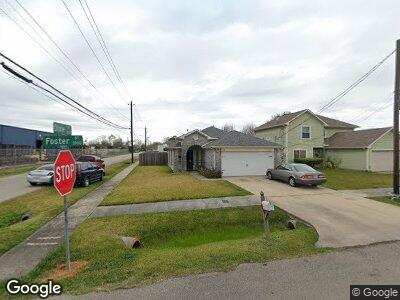
5930 Foster St Houston, TX 77021
OST-South Union NeighborhoodEstimated Value: $207,000 - $251,000
3
Beds
2
Baths
1,196
Sq Ft
$192/Sq Ft
Est. Value
About This Home
This home is located at 5930 Foster St, Houston, TX 77021 and is currently estimated at $230,047, approximately $192 per square foot. 5930 Foster St is a home located in Harris County with nearby schools including Peck Elementary School, Cullen Middle School, and Yates High School.
Ownership History
Date
Name
Owned For
Owner Type
Purchase Details
Closed on
Dec 27, 2005
Sold by
Williams Jimmy D and Williams Jacqueline G
Bought by
Ortega Amelia and Ortega Modesto
Current Estimated Value
Home Financials for this Owner
Home Financials are based on the most recent Mortgage that was taken out on this home.
Original Mortgage
$21,900
Interest Rate
6.2%
Mortgage Type
Stand Alone Second
Purchase Details
Closed on
Mar 24, 2005
Sold by
Moore Letha Mae
Bought by
Williams Jimmy D
Purchase Details
Closed on
Dec 22, 2003
Sold by
Williams Jimmy D and Williams Jacqueline G
Bought by
Moore Letha Mae
Purchase Details
Closed on
Jun 21, 2002
Sold by
Texas Colonial Homes Lp
Bought by
Williams Jimmy D and Williams Jacqueline G
Home Financials for this Owner
Home Financials are based on the most recent Mortgage that was taken out on this home.
Original Mortgage
$79,192
Interest Rate
6.89%
Create a Home Valuation Report for This Property
The Home Valuation Report is an in-depth analysis detailing your home's value as well as a comparison with similar homes in the area
Home Values in the Area
Average Home Value in this Area
Purchase History
| Date | Buyer | Sale Price | Title Company |
|---|---|---|---|
| Ortega Amelia | -- | Stewart | |
| Williams Jimmy D | -- | -- | |
| Moore Letha Mae | -- | -- | |
| Williams Jimmy D | -- | Stewart Title | |
| Texas Colonial Homes Lp | -- | Stewart Title |
Source: Public Records
Mortgage History
| Date | Status | Borrower | Loan Amount |
|---|---|---|---|
| Open | Ortega Amelia | $110,150 | |
| Closed | Ortega Modesto | $119,487 | |
| Closed | Ortega Amelia | $21,900 | |
| Closed | Ortega Amelia | $87,600 | |
| Previous Owner | Williams Jimmy D | $79,192 |
Source: Public Records
Tax History Compared to Growth
Tax History
| Year | Tax Paid | Tax Assessment Tax Assessment Total Assessment is a certain percentage of the fair market value that is determined by local assessors to be the total taxable value of land and additions on the property. | Land | Improvement |
|---|---|---|---|---|
| 2023 | $1,891 | $241,552 | $90,000 | $151,552 |
| 2022 | $3,151 | $225,376 | $70,000 | $155,376 |
| 2021 | $2,882 | $180,986 | $45,000 | $135,986 |
| 2020 | $2,851 | $121,684 | $30,000 | $91,684 |
| 2019 | $2,703 | $103,732 | $25,000 | $78,732 |
| 2018 | $1,588 | $109,094 | $20,000 | $89,094 |
| 2017 | $2,232 | $109,094 | $20,000 | $89,094 |
| 2016 | $2,029 | $91,475 | $20,000 | $71,475 |
| 2015 | $1,132 | $87,727 | $20,000 | $67,727 |
| 2014 | $1,132 | $63,448 | $12,500 | $50,948 |
Source: Public Records
Map
Nearby Homes
- 5910 Eastwood St
- 5914 Eastwood St
- 5909 Foster St
- 5907 Foster St
- 5908 Eastwood St
- 4351 Du Pont St
- 5823 Goforth St
- 6019 England St
- 5812 Goforth St
- 4504 Kingsbury St
- 6124 Goforth St
- 4135 Du Pont St
- 5920 Conley St
- 4014 England Ct E
- 4514 Keystone St
- 5906 Saint Augustine St Unit B
- 5906 Saint Augustine St Unit A
- 4526 Dixie Dr
- 4527 Dixie Dr
- 4523 Keystone St