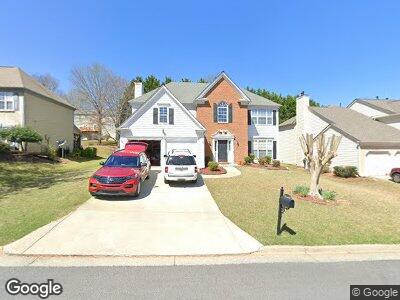
5950 Haterleigh Dr Alpharetta, GA 30005
Wellington NeighborhoodEstimated Value: $541,000 - $606,000
4
Beds
3
Baths
2,328
Sq Ft
$248/Sq Ft
Est. Value
About This Home
This home is located at 5950 Haterleigh Dr, Alpharetta, GA 30005 and is currently estimated at $577,140, approximately $247 per square foot. 5950 Haterleigh Dr is a home located in Fulton County with nearby schools including Taylor Road Middle School, Chattahoochee High School, and Cresco Montessori School - Johns Creek Campus.
Ownership History
Date
Name
Owned For
Owner Type
Purchase Details
Closed on
Oct 1, 2007
Sold by
Schantz Jeffrey L and Schantz Amie G
Bought by
Zhou Jingxue
Current Estimated Value
Home Financials for this Owner
Home Financials are based on the most recent Mortgage that was taken out on this home.
Original Mortgage
$200,000
Interest Rate
6.49%
Mortgage Type
New Conventional
Purchase Details
Closed on
Mar 28, 2001
Sold by
Schantz Jeffrey L
Bought by
Schantz Jeffrey L and Schantz Amie G
Home Financials for this Owner
Home Financials are based on the most recent Mortgage that was taken out on this home.
Original Mortgage
$178,500
Interest Rate
6.98%
Mortgage Type
New Conventional
Purchase Details
Closed on
Oct 29, 1997
Sold by
Pulte Home Corp
Bought by
Schantz Jeffrey L
Create a Home Valuation Report for This Property
The Home Valuation Report is an in-depth analysis detailing your home's value as well as a comparison with similar homes in the area
Home Values in the Area
Average Home Value in this Area
Purchase History
| Date | Buyer | Sale Price | Title Company |
|---|---|---|---|
| Zhou Jingxue | $263,000 | -- | |
| Schantz Jeffrey L | -- | -- | |
| Schantz Jeffrey L | $164,200 | -- |
Source: Public Records
Mortgage History
| Date | Status | Borrower | Loan Amount |
|---|---|---|---|
| Open | Zhou Jingxue | $162,000 | |
| Closed | Zhou Jingxue | $200,000 | |
| Previous Owner | Schantz Jeffrey L | $22,500 | |
| Previous Owner | Schantz Jeffrey L | $20,706 | |
| Previous Owner | Schantz Jeffrey L | $180,000 | |
| Previous Owner | Schantz Jeffrey L | $178,500 | |
| Closed | Schantz Jeffrey L | -- |
Source: Public Records
Tax History Compared to Growth
Tax History
| Year | Tax Paid | Tax Assessment Tax Assessment Total Assessment is a certain percentage of the fair market value that is determined by local assessors to be the total taxable value of land and additions on the property. | Land | Improvement |
|---|---|---|---|---|
| 2023 | $3,372 | $217,440 | $32,960 | $184,480 |
| 2022 | $3,224 | $172,840 | $32,840 | $140,000 |
| 2021 | $3,185 | $141,320 | $25,240 | $116,080 |
| 2020 | $3,206 | $136,600 | $23,880 | $112,720 |
| 2019 | $377 | $141,080 | $26,760 | $114,320 |
| 2018 | $3,537 | $123,880 | $20,960 | $102,920 |
| 2017 | $3,039 | $101,440 | $16,400 | $85,040 |
| 2016 | $2,987 | $101,440 | $16,400 | $85,040 |
| 2015 | $2,752 | $93,560 | $16,400 | $77,160 |
| 2014 | $2,594 | $86,600 | $15,720 | $70,880 |
Source: Public Records
Map
Nearby Homes
- 900 Cherringham Ct
- 230 Ascalon Ct
- 245 Davenham Ct
- 205 Devon Downs Place
- 5755 Haterleigh Dr Unit 1
- 11595 Carriage Park Ln
- 415 Chippenham Ct
- 415 Chippenham Ct Unit 2
- 11770 Ashwick Place Unit 1
- 615 Arncliffe Ct
- 400 Lamme Chase Unit 2
- 230 Bristolstone Ct Unit 5
- 11365 Donnington Dr
- 280 Leaf Ct
- 400 Overhill Bend
- 940 Magnolia Blossom Ct Unit 4D
- 935 Magnolia Blossom Ct
- 5700 Abbotts Bridge Rd