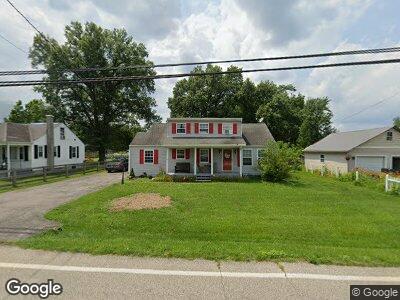
5969 Newtonsville Hutchinson Rd Batavia, OH 45103
Estimated Value: $220,629 - $245,000
3
Beds
1
Bath
1,500
Sq Ft
$157/Sq Ft
Est. Value
About This Home
This home is located at 5969 Newtonsville Hutchinson Rd, Batavia, OH 45103 and is currently estimated at $235,157, approximately $156 per square foot. 5969 Newtonsville Hutchinson Rd is a home located in Clermont County with nearby schools including Clermont Northeastern Elementary School, Clermont Northeastern Middle School, and Clermont Northeastern High School.
Ownership History
Date
Name
Owned For
Owner Type
Purchase Details
Closed on
Apr 12, 2023
Sold by
Jones Rebecca R
Bought by
Koors Morgan
Current Estimated Value
Home Financials for this Owner
Home Financials are based on the most recent Mortgage that was taken out on this home.
Original Mortgage
$192,449
Outstanding Balance
$188,316
Interest Rate
6.65%
Mortgage Type
FHA
Estimated Equity
$46,841
Purchase Details
Closed on
Feb 26, 2016
Sold by
Kidwell Thomas A
Bought by
Minnie B Kidwell
Home Financials for this Owner
Home Financials are based on the most recent Mortgage that was taken out on this home.
Interest Rate
3.62%
Purchase Details
Closed on
Mar 2, 2004
Sold by
Kidwell Thomas A and Kidwell Minnie B
Bought by
Kidwell Thomas A and Kidwell Minnie B
Create a Home Valuation Report for This Property
The Home Valuation Report is an in-depth analysis detailing your home's value as well as a comparison with similar homes in the area
Home Values in the Area
Average Home Value in this Area
Purchase History
| Date | Buyer | Sale Price | Title Company |
|---|---|---|---|
| Koors Morgan | $196,000 | None Listed On Document | |
| Minnie B Kidwell | -- | -- | |
| Kidwell Thomas A | -- | -- |
Source: Public Records
Mortgage History
| Date | Status | Borrower | Loan Amount |
|---|---|---|---|
| Open | Koors Morgan | $192,449 | |
| Previous Owner | Minnie B Kidwell | -- | |
| Previous Owner | Kidwell Thomas A | $30,000 |
Source: Public Records
Tax History Compared to Growth
Tax History
| Year | Tax Paid | Tax Assessment Tax Assessment Total Assessment is a certain percentage of the fair market value that is determined by local assessors to be the total taxable value of land and additions on the property. | Land | Improvement |
|---|---|---|---|---|
| 2024 | $1,542 | $45,510 | $12,570 | $32,940 |
| 2023 | $1,584 | $45,510 | $12,570 | $32,940 |
| 2022 | $1,032 | $37,350 | $10,260 | $27,090 |
| 2021 | $1,033 | $37,350 | $10,260 | $27,090 |
| 2020 | $1,032 | $37,350 | $10,260 | $27,090 |
| 2019 | $1,080 | $38,330 | $9,420 | $28,910 |
| 2018 | $1,080 | $38,330 | $9,420 | $28,910 |
| 2017 | $937 | $38,330 | $9,420 | $28,910 |
| 2016 | $937 | $33,320 | $8,190 | $25,130 |
| 2015 | $894 | $33,320 | $8,190 | $25,130 |
| 2014 | $894 | $33,320 | $8,190 | $25,130 |
| 2013 | $905 | $32,310 | $8,750 | $23,560 |
Source: Public Records
Map
Nearby Homes
- 2735 Ohio 131
- 3369 Weaver Rd
- 700 South
- 1750 Parkfield Way
- 5504 Hutchinson Rd
- 5406 Ohio 133
- 6299 Roudebush Rd
- 5334 Bucktown Rd
- 6577 Joellen Dr
- 0 Bucktown Rd Unit 1808462
- 6433 Goshen Rd
- 1971 Cedarville Rd
- 2389 Whitmer Rd
- 5532 Malsbeary Rd
- 312 E Main St
- 0 E Main St Unit 1790616
- 6563 Ohio 133
- 6122 Lakefield Place
- 6570 Ohio 133
- 6134 Lakefield Place