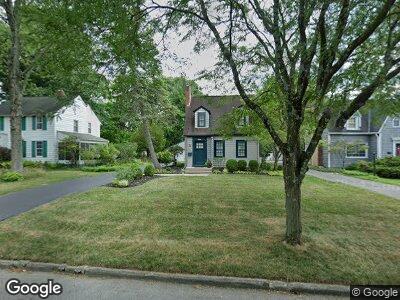
597 Garden Rd Unit OZEM Columbus, OH 43214
Clintonville NeighborhoodEstimated Value: $425,698 - $458,000
3
Beds
3
Baths
1,933
Sq Ft
$228/Sq Ft
Est. Value
About This Home
This home is located at 597 Garden Rd Unit OZEM, Columbus, OH 43214 and is currently estimated at $441,425, approximately $228 per square foot. 597 Garden Rd Unit OZEM is a home located in Franklin County with nearby schools including Colerain Elementary School, Dominion Middle School, and Whetstone High School.
Ownership History
Date
Name
Owned For
Owner Type
Purchase Details
Closed on
Apr 15, 2016
Sold by
Hu Yiguang and Wang Yinghui
Bought by
Le Thu T and Dinh Chau T
Current Estimated Value
Home Financials for this Owner
Home Financials are based on the most recent Mortgage that was taken out on this home.
Original Mortgage
$90,000
Outstanding Balance
$72,651
Interest Rate
3.68%
Mortgage Type
New Conventional
Estimated Equity
$367,338
Purchase Details
Closed on
Jul 3, 2002
Sold by
Shamrock Investment Co
Bought by
Hu Yiguang and Wang Yinghui
Home Financials for this Owner
Home Financials are based on the most recent Mortgage that was taken out on this home.
Original Mortgage
$158,900
Interest Rate
6.79%
Mortgage Type
Purchase Money Mortgage
Purchase Details
Closed on
Jun 5, 1991
Bought by
Shamrock Investment Co
Create a Home Valuation Report for This Property
The Home Valuation Report is an in-depth analysis detailing your home's value as well as a comparison with similar homes in the area
Home Values in the Area
Average Home Value in this Area
Purchase History
| Date | Buyer | Sale Price | Title Company |
|---|---|---|---|
| Le Thu T | $223,000 | Genesis Title | |
| Hu Yiguang | $187,000 | -- | |
| Shamrock Investment Co | $126,200 | -- |
Source: Public Records
Mortgage History
| Date | Status | Borrower | Loan Amount |
|---|---|---|---|
| Open | Le Thu T | $90,000 | |
| Previous Owner | Hu Yiguang | $151,000 | |
| Previous Owner | Hu Yiguang | $150,400 | |
| Previous Owner | Hu Yiguang | $158,900 |
Source: Public Records
Tax History Compared to Growth
Tax History
| Year | Tax Paid | Tax Assessment Tax Assessment Total Assessment is a certain percentage of the fair market value that is determined by local assessors to be the total taxable value of land and additions on the property. | Land | Improvement |
|---|---|---|---|---|
| 2024 | $7,487 | $121,940 | $38,500 | $83,440 |
| 2023 | $7,159 | $121,940 | $38,500 | $83,440 |
| 2022 | $6,410 | $86,630 | $18,900 | $67,730 |
| 2021 | $5,913 | $86,630 | $18,900 | $67,730 |
| 2020 | $5,696 | $86,630 | $18,900 | $67,730 |
| 2019 | $5,299 | $72,730 | $15,750 | $56,980 |
| 2018 | $2,567 | $72,730 | $15,750 | $56,980 |
| 2017 | $4,749 | $72,730 | $15,750 | $56,980 |
| 2016 | $4,940 | $69,580 | $20,370 | $49,210 |
| 2015 | $2,470 | $69,580 | $20,370 | $49,210 |
| 2014 | $4,939 | $69,580 | $20,370 | $49,210 |
| 2013 | $2,457 | $69,580 | $20,370 | $49,210 |
Source: Public Records
Map
Nearby Homes
- 623 E Dominion Blvd
- 673 Wetmore Rd
- 678 E Royal Forest Blvd
- 4451 Glenmawr Ave
- 324 Garden Rd
- 576 E Jeffrey Place
- 392 E Beechwold Blvd
- 581 Morse Rd
- 224 Morse Rd
- 243 E Schreyer Place
- 470 Canyon Dr NE
- 4336 Sandy Lane Rd
- 180 E Cooke Rd
- 1087 Loring Rd
- 421 Glenmont Ave
- 999 E Cooke Rd
- 524 Blenheim Rd
- 4390 Maize Rd
- 37 Morse Rd
- 352 Northridge Rd