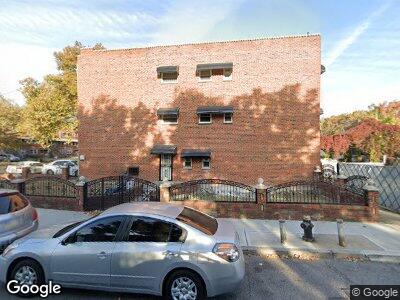
599 E 80th St Brooklyn, NY 11236
Canarsie NeighborhoodEstimated Value: $963,079 - $1,131,000
6
Beds
4
Baths
3,230
Sq Ft
$325/Sq Ft
Est. Value
About This Home
This home is located at 599 E 80th St, Brooklyn, NY 11236 and is currently estimated at $1,051,270, approximately $325 per square foot. 599 E 80th St is a home located in Kings County with nearby schools including P.S. 276 Louis Marshall, Is 68 Isaac Bildersee, and Explore Excel Charter School.
Ownership History
Date
Name
Owned For
Owner Type
Purchase Details
Closed on
Dec 19, 2023
Sold by
431 Autumn Realty Llc
Bought by
Almonte Justin Rene
Current Estimated Value
Purchase Details
Closed on
Mar 5, 2020
Sold by
Marie C Merveille C and Marie Carmen Merveille
Bought by
431 Autumn Realty Llc
Purchase Details
Closed on
Jan 28, 2012
Sold by
Johnson Alick and Merveille Marie C
Bought by
Merveille Marie C
Purchase Details
Closed on
Feb 20, 2007
Sold by
Reynolds Blossom and Reynolds Cleveland A
Bought by
Johnson Alick and Merveille Marie C
Home Financials for this Owner
Home Financials are based on the most recent Mortgage that was taken out on this home.
Original Mortgage
$137,000
Interest Rate
6.3%
Purchase Details
Closed on
Jun 18, 2003
Sold by
Reynolds Blossom and Reynolds Cleveland A
Bought by
Reynolds Blossom and Reynolds Cleveland A
Create a Home Valuation Report for This Property
The Home Valuation Report is an in-depth analysis detailing your home's value as well as a comparison with similar homes in the area
Home Values in the Area
Average Home Value in this Area
Purchase History
| Date | Buyer | Sale Price | Title Company |
|---|---|---|---|
| Almonte Justin Rene | -- | -- | |
| Almonte Justin Rene | -- | -- | |
| 431 Autumn Realty Llc | $585,000 | -- | |
| 431 Autumn Realty Llc | $585,000 | -- | |
| Merveille Marie C | -- | -- | |
| Merveille Marie C | -- | -- | |
| Johnson Alick | $685,000 | -- | |
| Johnson Alick | $685,000 | -- | |
| Reynolds Blossom | -- | -- | |
| Reynolds Blossom | -- | -- |
Source: Public Records
Mortgage History
| Date | Status | Borrower | Loan Amount |
|---|---|---|---|
| Open | Almonte Justin R | $499,999 | |
| Previous Owner | Johnson Alick | $137,000 | |
| Previous Owner | Johnson Alick | $548,000 | |
| Previous Owner | Reynolds Blossom | $100,000 |
Source: Public Records
Tax History Compared to Growth
Tax History
| Year | Tax Paid | Tax Assessment Tax Assessment Total Assessment is a certain percentage of the fair market value that is determined by local assessors to be the total taxable value of land and additions on the property. | Land | Improvement |
|---|---|---|---|---|
| 2024 | $10,508 | $52,320 | $22,680 | $29,640 |
| 2023 | $10,416 | $57,840 | $22,680 | $35,160 |
| 2022 | $9,659 | $63,360 | $22,680 | $40,680 |
| 2021 | $10,168 | $57,600 | $22,680 | $34,920 |
| 2020 | $9,593 | $43,620 | $22,680 | $20,940 |
| 2019 | $9,125 | $43,620 | $22,680 | $20,940 |
| 2018 | $8,712 | $42,739 | $20,169 | $22,570 |
| 2017 | $8,219 | $40,320 | $22,680 | $17,640 |
| 2016 | $8,049 | $40,264 | $20,764 | $19,500 |
| 2015 | $4,719 | $37,987 | $17,817 | $20,170 |
| 2014 | $4,719 | $37,987 | $16,942 | $21,045 |
Source: Public Records
Map
Nearby Homes
- 555 E 80th St
- 582 E 82nd St
- 617 E 78th St
- 590 E 83rd St
- 590 E 83rd St Unit 1
- 674 E 83rd St
- 665 E 59th St
- 608 E 85th St
- 730 E 82nd St
- 674 E 59th St
- 678 E 77th St
- 8308 Glenwood Rd
- 717 E 58th St
- 670 E 85th St
- 747 E 78th St
- 655 E 85th St
- 522 E 86th St
- 573 E 86th St
- 719 E 85th St Unit 402
- 548 E 87th St Unit 1