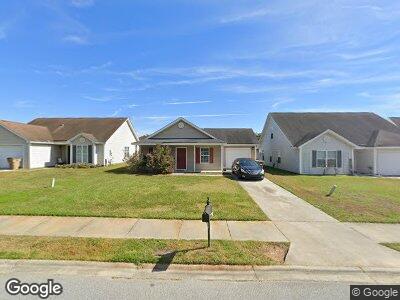
60 Corsair Cir Savannah, GA 31407
Estimated Value: $216,000 - $254,000
3
Beds
2
Baths
1,196
Sq Ft
$200/Sq Ft
Est. Value
About This Home
This home is located at 60 Corsair Cir, Savannah, GA 31407 and is currently estimated at $238,799, approximately $199 per square foot. 60 Corsair Cir is a home located in Chatham County with nearby schools including Rice Creek K-8 School and Groves High School.
Ownership History
Date
Name
Owned For
Owner Type
Purchase Details
Closed on
Dec 14, 2017
Sold by
Bluemle Benjamin J
Bought by
Kab Homes Llc
Current Estimated Value
Home Financials for this Owner
Home Financials are based on the most recent Mortgage that was taken out on this home.
Original Mortgage
$71,250
Interest Rate
3.95%
Mortgage Type
New Conventional
Purchase Details
Closed on
Sep 5, 2017
Sold by
Maxwell Stevie T
Bought by
Jpmorgan Chase Bank National A
Purchase Details
Closed on
Jun 23, 2009
Sold by
Homebuilders Fred Williams
Bought by
Maxwell Stevie T
Home Financials for this Owner
Home Financials are based on the most recent Mortgage that was taken out on this home.
Original Mortgage
$119,413
Interest Rate
4.88%
Mortgage Type
New Conventional
Purchase Details
Closed on
Apr 6, 2009
Sold by
New City Development Llc
Bought by
Fred Williams Homebuilder Inc
Purchase Details
Closed on
Jul 14, 2005
Sold by
Not Provided
Bought by
Maxwell Stevie T
Create a Home Valuation Report for This Property
The Home Valuation Report is an in-depth analysis detailing your home's value as well as a comparison with similar homes in the area
Home Values in the Area
Average Home Value in this Area
Purchase History
| Date | Buyer | Sale Price | Title Company |
|---|---|---|---|
| Kab Homes Llc | -- | -- | |
| Bluemle Benjamin J | $95,001 | -- | |
| Jpmorgan Chase Bank National A | $92,820 | -- | |
| Maxwell Stevie T | $117,025 | -- | |
| Fred Williams Homebuilder Inc | $99,900 | -- | |
| Maxwell Stevie T | $555,300 | -- |
Source: Public Records
Mortgage History
| Date | Status | Borrower | Loan Amount |
|---|---|---|---|
| Open | Kab Homes Llc | $342,000 | |
| Closed | Johnson Jessica | $169,866 | |
| Closed | Bluemle Benjamin J | $71,250 | |
| Previous Owner | Maxwell Stevie T | $119,413 |
Source: Public Records
Tax History Compared to Growth
Tax History
| Year | Tax Paid | Tax Assessment Tax Assessment Total Assessment is a certain percentage of the fair market value that is determined by local assessors to be the total taxable value of land and additions on the property. | Land | Improvement |
|---|---|---|---|---|
| 2024 | $1,039 | $72,400 | $18,000 | $54,400 |
| 2023 | $1,039 | $80,520 | $18,000 | $62,520 |
| 2022 | $1,892 | $64,320 | $8,000 | $56,320 |
| 2021 | $1,896 | $55,920 | $8,000 | $47,920 |
| 2020 | $1,653 | $54,480 | $8,000 | $46,480 |
| 2019 | $2,318 | $47,800 | $8,000 | $39,800 |
| 2018 | $1,330 | $38,000 | $6,574 | $31,426 |
| 2017 | $1,354 | $46,600 | $8,000 | $38,600 |
| 2016 | $1,141 | $40,080 | $8,000 | $32,080 |
| 2015 | $1,156 | $40,480 | $8,000 | $32,480 |
| 2014 | $1,617 | $38,920 | $0 | $0 |
Source: Public Records
Map
Nearby Homes
- 89 Tiller Way
- 8 Cutlass Ct
- 49 Gimbal Cir
- 33 Gimbal Cir
- 1 Stemson Way
- 37 Bearing Cir
- 58 Bearing Cir Unit B
- 165 Fox Glen Ct
- 0 Berrien Rd Unit 312774
- 430 Punkin Bridge Rd
- 46 Brown Thrasher Ct
- 217 Monteith Rd
- 0 Saussy Rd
- 13 Laurel Ln
- 136 Basswood Dr Unit 8
- 20 Lake Shore Blvd
- 135 Monteith Rd
- 4 Rivermoor Ct
- 387 Augusta Rd
- 0 Jeffers Rd