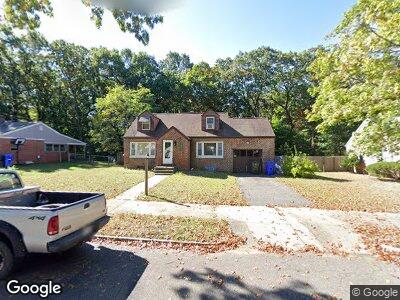
60 Saint Lawrence Ave Springfield, MA 01104
Liberty Heights NeighborhoodEstimated Value: $159,677 - $273,000
4
Beds
2
Baths
1,400
Sq Ft
$151/Sq Ft
Est. Value
About This Home
This home is located at 60 Saint Lawrence Ave, Springfield, MA 01104 and is currently estimated at $211,419, approximately $151 per square foot. 60 Saint Lawrence Ave is a home located in Hampden County with nearby schools including Glenwood School, Van Sickle Academy, and High School Of Commerce.
Ownership History
Date
Name
Owned For
Owner Type
Purchase Details
Closed on
Nov 5, 2012
Sold by
Murphy Marguerite V Es and Murphy M
Bought by
Murphy William F
Current Estimated Value
Home Financials for this Owner
Home Financials are based on the most recent Mortgage that was taken out on this home.
Original Mortgage
$83,000
Interest Rate
3.44%
Purchase Details
Closed on
Apr 15, 2008
Sold by
Frydryk Barbara M and Frydryk Kane M
Bought by
Murphy Marguerite V
Home Financials for this Owner
Home Financials are based on the most recent Mortgage that was taken out on this home.
Original Mortgage
$243,000
Interest Rate
5.91%
Create a Home Valuation Report for This Property
The Home Valuation Report is an in-depth analysis detailing your home's value as well as a comparison with similar homes in the area
Home Values in the Area
Average Home Value in this Area
Purchase History
| Date | Buyer | Sale Price | Title Company |
|---|---|---|---|
| Murphy William F | $16,000 | -- | |
| Murphy William F | $16,000 | -- | |
| Murphy Marguerite V | -- | -- | |
| Murphy Marguerite | -- | -- |
Source: Public Records
Mortgage History
| Date | Status | Borrower | Loan Amount |
|---|---|---|---|
| Open | Brightwood Properties Llc | $128,000 | |
| Closed | Brightwood Properties Llc | $128,000 | |
| Closed | Murphy William F | $83,000 | |
| Previous Owner | Murphy Marguerite | $243,000 |
Source: Public Records
Tax History Compared to Growth
Tax History
| Year | Tax Paid | Tax Assessment Tax Assessment Total Assessment is a certain percentage of the fair market value that is determined by local assessors to be the total taxable value of land and additions on the property. | Land | Improvement |
|---|---|---|---|---|
| 2024 | $3,536 | $220,200 | $39,500 | $180,700 |
| 2023 | $3,870 | $227,000 | $35,000 | $192,000 |
| 2022 | $3,305 | $175,600 | $32,700 | $142,900 |
| 2021 | $3,009 | $159,200 | $29,700 | $129,500 |
| 2020 | $2,996 | $153,400 | $29,700 | $123,700 |
| 2019 | $2,958 | $150,300 | $32,300 | $118,000 |
| 2018 | $2,885 | $146,600 | $32,300 | $114,300 |
| 2017 | $2,809 | $142,900 | $29,200 | $113,700 |
| 2016 | $2,908 | $147,900 | $27,700 | $120,200 |
| 2015 | $2,746 | $139,600 | $27,700 | $111,900 |
Source: Public Records
Map
Nearby Homes
- 97 David St
- 142-144 Miller St
- 596-598 Newbury St
- 702 Newbury St
- 63 Langdon St
- 100-102 Wait St
- 58 Bevier St
- 903 Liberty St
- 14 Tourigny St
- 46-48 Wait St
- 58 Governor St
- 739-741 Carew St
- 66 Alvin St
- 59-61 Farnsworth St
- 107-109 Parkside St
- 33 Farnsworth St
- 513-515 Armory St
- 592-596 Carew St
- 93 Strong St
- 289-291 Lexington St