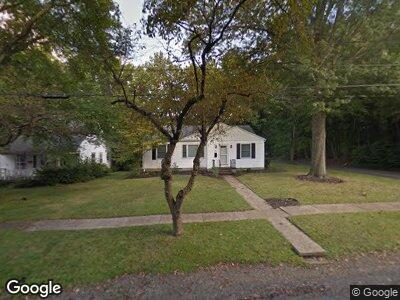
601 Edgewood Dr Kent, OH 44240
Crain to Main NeighborhoodEstimated Value: $169,000 - $216,000
3
Beds
2
Baths
984
Sq Ft
$189/Sq Ft
Est. Value
About This Home
This home is located at 601 Edgewood Dr, Kent, OH 44240 and is currently estimated at $186,004, approximately $189 per square foot. 601 Edgewood Dr is a home located in Portage County with nearby schools including Walls Elementary School, Stanton Middle School, and Theodore Roosevelt High School.
Ownership History
Date
Name
Owned For
Owner Type
Purchase Details
Closed on
Jul 20, 2004
Sold by
Ashton Don Lee and Ashton Rachelle M
Bought by
Ashton Jason W and Ashton Angela M
Current Estimated Value
Home Financials for this Owner
Home Financials are based on the most recent Mortgage that was taken out on this home.
Original Mortgage
$100,000
Interest Rate
6.42%
Mortgage Type
Purchase Money Mortgage
Purchase Details
Closed on
Jan 22, 1992
Bought by
Tedrow Virginia Ashton
Create a Home Valuation Report for This Property
The Home Valuation Report is an in-depth analysis detailing your home's value as well as a comparison with similar homes in the area
Home Values in the Area
Average Home Value in this Area
Purchase History
| Date | Buyer | Sale Price | Title Company |
|---|---|---|---|
| Ashton Jason W | $125,000 | Kent Title Agency Inc | |
| Tedrow Virginia Ashton | -- | -- |
Source: Public Records
Mortgage History
| Date | Status | Borrower | Loan Amount |
|---|---|---|---|
| Open | Ashton Jason W | $91,300 | |
| Closed | Ashton Jason W | $8,000 | |
| Closed | Ashton Jason W | $100,000 | |
| Closed | Ashton Don L | $50,000 |
Source: Public Records
Tax History Compared to Growth
Tax History
| Year | Tax Paid | Tax Assessment Tax Assessment Total Assessment is a certain percentage of the fair market value that is determined by local assessors to be the total taxable value of land and additions on the property. | Land | Improvement |
|---|---|---|---|---|
| 2024 | $2,733 | $60,970 | $15,820 | $45,150 |
| 2023 | $2,633 | $47,680 | $10,050 | $37,630 |
| 2022 | $2,631 | $47,680 | $10,050 | $37,630 |
| 2021 | $2,636 | $47,680 | $10,050 | $37,630 |
| 2020 | $2,565 | $41,410 | $10,050 | $31,360 |
| 2019 | $2,565 | $41,410 | $10,050 | $31,360 |
| 2018 | $2,551 | $35,250 | $10,920 | $24,330 |
| 2017 | $2,360 | $35,250 | $10,920 | $24,330 |
| 2016 | $2,354 | $35,250 | $10,920 | $24,330 |
| 2015 | $2,355 | $35,250 | $10,920 | $24,330 |
| 2014 | $2,394 | $35,250 | $10,920 | $24,330 |
| 2013 | $2,377 | $35,250 | $10,920 | $24,330 |
Source: Public Records
Map
Nearby Homes