6012 M Avenue Place Kearney, NE 68847
Estimated Value: $369,000 - $536,000
3
Beds
2
Baths
1,652
Sq Ft
$274/Sq Ft
Est. Value
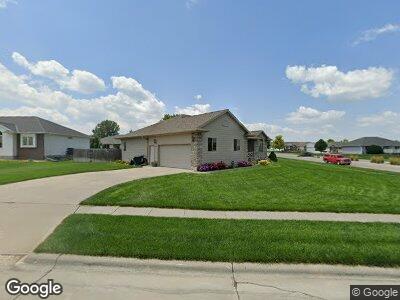
About This Home
This home is located at 6012 M Avenue Place, Kearney, NE 68847 and is currently estimated at $453,026, approximately $274 per square foot. 6012 M Avenue Place is a home located in Buffalo County with nearby schools including Meadowlark Elementary School, Sunrise Middle School, and Kearney Senior High School.
Ownership History
Date
Name
Owned For
Owner Type
Purchase Details
Closed on
May 26, 2011
Sold by
Jasnoch Kelly J and Jasnoch Geri M
Bought by
Paulsen Steven K and Paulsen Joni S
Current Estimated Value
Home Financials for this Owner
Home Financials are based on the most recent Mortgage that was taken out on this home.
Original Mortgage
$120,000
Interest Rate
4.81%
Purchase Details
Closed on
Apr 30, 2007
Sold by
Butts Randal R and Butts Christi J
Bought by
Jasnoch Kelly J and Jasnoch Geri M
Home Financials for this Owner
Home Financials are based on the most recent Mortgage that was taken out on this home.
Original Mortgage
$204,000
Interest Rate
6.13%
Purchase Details
Closed on
Sep 7, 2005
Sold by
Np Land Development Inc
Bought by
Butts Randal R
Home Financials for this Owner
Home Financials are based on the most recent Mortgage that was taken out on this home.
Original Mortgage
$210,000
Interest Rate
5.88%
Mortgage Type
Construction
Create a Home Valuation Report for This Property
The Home Valuation Report is an in-depth analysis detailing your home's value as well as a comparison with similar homes in the area
Home Values in the Area
Average Home Value in this Area
Purchase History
| Date | Buyer | Sale Price | Title Company |
|---|---|---|---|
| Paulsen Steven K | $235,000 | Barney | |
| Jasnoch Kelly J | $204,000 | Barney | |
| Butts Randal R | $32,500 | -- |
Source: Public Records
Mortgage History
| Date | Status | Borrower | Loan Amount |
|---|---|---|---|
| Open | Paulsen Steven K | $65,000 | |
| Closed | Paulsen Steven K | $25,000 | |
| Closed | Paulsen Steven K | $120,000 | |
| Previous Owner | Jasnoch Kelly J | $204,000 | |
| Previous Owner | Butts Randal R | $210,000 |
Source: Public Records
Tax History Compared to Growth
Tax History
| Year | Tax Paid | Tax Assessment Tax Assessment Total Assessment is a certain percentage of the fair market value that is determined by local assessors to be the total taxable value of land and additions on the property. | Land | Improvement |
|---|---|---|---|---|
| 2024 | $5,392 | $407,800 | $64,325 | $343,475 |
| 2023 | $6,569 | $385,955 | $64,325 | $321,630 |
| 2022 | $5,705 | $325,065 | $61,125 | $263,940 |
| 2021 | $5,205 | $301,765 | $57,065 | $244,700 |
| 2020 | $5,270 | $304,680 | $57,065 | $247,615 |
| 2019 | $5,123 | $292,565 | $57,065 | $235,500 |
| 2018 | $4,874 | $282,400 | $53,915 | $228,485 |
| 2017 | $4,567 | $266,370 | $51,415 | $214,955 |
| 2016 | $4,588 | $269,785 | $51,415 | $218,370 |
| 2015 | $4,652 | $267,415 | $0 | $0 |
| 2014 | $4,699 | $246,475 | $0 | $0 |
Source: Public Records
Map
Nearby Homes
- 5811 P Avenue Place
- 6519 O Avenue Place
- 1409 E 64th St
- L9 B2 S Ave
- TBD E 58th St Unit L7B2 Spruce Hollow W
- L8B2 E 58th St
- 5308 I Ave
- 6610-6612 L Avenue Place
- 6614-6616 Avenue L Place
- 1015 E 48th St
- 56th Parklane Dr
- 118 E 56th St Unit Kearney
- 1803 E 48th St
- 5713 2nd Ave
- 5911 Luxor Dr N
- 4635 Parklane Dr
- 4610 Pony Express Rd
- 2122 E 41st St
- 2124 E 41st St
- 2114 E 41st St