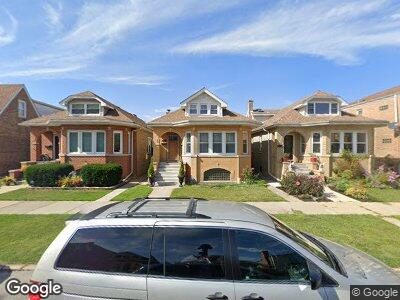
6018 W Eddy St Chicago, IL 60634
Portage Park NeighborhoodEstimated Value: $326,000 - $430,000
3
Beds
1
Bath
1,200
Sq Ft
$322/Sq Ft
Est. Value
About This Home
This home is located at 6018 W Eddy St, Chicago, IL 60634 and is currently estimated at $386,708, approximately $322 per square foot. 6018 W Eddy St is a home located in Cook County with nearby schools including Reinberg Elementary School, Schurz High School, and Pope Francis Global Academy.
Ownership History
Date
Name
Owned For
Owner Type
Purchase Details
Closed on
Oct 8, 2002
Sold by
Zappani Giuseppe
Bought by
Delossantos Jose
Current Estimated Value
Home Financials for this Owner
Home Financials are based on the most recent Mortgage that was taken out on this home.
Original Mortgage
$206,800
Interest Rate
6.24%
Purchase Details
Closed on
May 10, 2000
Sold by
Grzybowicz Ryszard and Grzybowicz Halina
Bought by
Zappani Giuseppe
Purchase Details
Closed on
Feb 7, 1997
Sold by
Hanson Michael T and Hanson Carmen M
Bought by
Grzybowicz Ryszard and Grzybowicz Halina
Home Financials for this Owner
Home Financials are based on the most recent Mortgage that was taken out on this home.
Original Mortgage
$124,600
Interest Rate
7.92%
Create a Home Valuation Report for This Property
The Home Valuation Report is an in-depth analysis detailing your home's value as well as a comparison with similar homes in the area
Home Values in the Area
Average Home Value in this Area
Purchase History
| Date | Buyer | Sale Price | Title Company |
|---|---|---|---|
| Delossantos Jose | $258,500 | Chicago Title Insurance Co | |
| Zappani Giuseppe | $140,000 | -- | |
| Grzybowicz Ryszard | $156,000 | -- |
Source: Public Records
Mortgage History
| Date | Status | Borrower | Loan Amount |
|---|---|---|---|
| Closed | Delos Santos Mirabel | $143,100 | |
| Closed | Delos Santos Maribel | $81,250 | |
| Closed | Santos Jose D | $64,704 | |
| Closed | Delos Santos Jose | $206,800 | |
| Closed | Delossantos Jose | $21,000 | |
| Closed | Delossantos Jose | $206,800 | |
| Previous Owner | Grzybowicz Ryszard | $124,600 |
Source: Public Records
Tax History Compared to Growth
Tax History
| Year | Tax Paid | Tax Assessment Tax Assessment Total Assessment is a certain percentage of the fair market value that is determined by local assessors to be the total taxable value of land and additions on the property. | Land | Improvement |
|---|---|---|---|---|
| 2024 | $5,535 | $30,000 | $13,230 | $16,770 |
| 2023 | $5,535 | $31,000 | $10,584 | $20,416 |
| 2022 | $5,535 | $31,000 | $10,584 | $20,416 |
| 2021 | $5,567 | $31,000 | $10,584 | $20,416 |
| 2020 | $4,272 | $22,269 | $4,725 | $17,544 |
| 2019 | $4,341 | $25,022 | $4,725 | $20,297 |
| 2018 | $4,267 | $25,022 | $4,725 | $20,297 |
| 2017 | $4,062 | $22,236 | $4,158 | $18,078 |
| 2016 | $3,956 | $22,236 | $4,158 | $18,078 |
| 2015 | $3,596 | $22,236 | $4,158 | $18,078 |
| 2014 | $4,284 | $25,640 | $3,780 | $21,860 |
| 2013 | $4,188 | $25,640 | $3,780 | $21,860 |
Source: Public Records
Map
Nearby Homes
- 5927 W Addison St Unit 2B
- 6048 W Waveland Ave
- 5832 W Cornelia Ave
- 5853 W Newport Ave
- 5952 W Warwick Ave
- 5841 W Warwick Ave
- 6249 W Addison St
- 6229 W Waveland Ave
- 5912 W Grace St
- 6308 W Cornelia Ave
- 5758 W Roscoe St
- 6120 W Berenice Ave
- 6100 W Byron St
- 5645 W Eddy St
- 5825 W Byron St
- 5829 W Melrose St
- 3444 N Narragansett Ave Unit 3
- 6036 W Dakin St
- 6347 W Henderson St
- 3448 N Central Ave