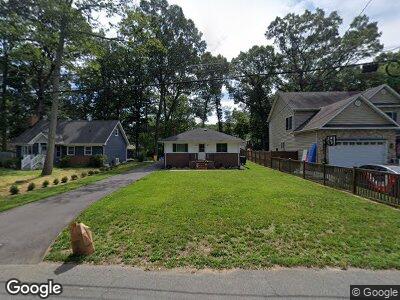
605 Cedarwood Ln Crownsville, MD 21032
Arden on the Severn NeighborhoodEstimated Value: $417,489 - $490,000
2
Beds
1
Bath
945
Sq Ft
$477/Sq Ft
Est. Value
About This Home
This home is located at 605 Cedarwood Ln, Crownsville, MD 21032 and is currently estimated at $450,372, approximately $476 per square foot. 605 Cedarwood Ln is a home located in Anne Arundel County with nearby schools including Millersville Elementary School, Old Mill High School, and Rockbridge Academy.
Ownership History
Date
Name
Owned For
Owner Type
Purchase Details
Closed on
Mar 24, 2016
Sold by
Hatcher Kevin R and Gurley Breanne P
Bought by
Robinson Timothy S and Winters Allison M
Current Estimated Value
Home Financials for this Owner
Home Financials are based on the most recent Mortgage that was taken out on this home.
Original Mortgage
$256,000
Outstanding Balance
$206,810
Interest Rate
3.62%
Mortgage Type
New Conventional
Estimated Equity
$237,365
Purchase Details
Closed on
Oct 10, 2008
Sold by
Zeikus Bronius
Bought by
Hatcher Kevin R and Gurley Breanne P
Home Financials for this Owner
Home Financials are based on the most recent Mortgage that was taken out on this home.
Original Mortgage
$278,797
Interest Rate
6.43%
Mortgage Type
FHA
Purchase Details
Closed on
Sep 25, 2008
Sold by
Zeikus Bronius
Bought by
Hatcher Kevin R and Gurley Breanne P
Home Financials for this Owner
Home Financials are based on the most recent Mortgage that was taken out on this home.
Original Mortgage
$278,797
Interest Rate
6.43%
Mortgage Type
FHA
Create a Home Valuation Report for This Property
The Home Valuation Report is an in-depth analysis detailing your home's value as well as a comparison with similar homes in the area
Home Values in the Area
Average Home Value in this Area
Purchase History
| Date | Buyer | Sale Price | Title Company |
|---|---|---|---|
| Robinson Timothy S | $320,000 | Attorney | |
| Hatcher Kevin R | $281,000 | -- | |
| Hatcher Kevin R | $281,000 | -- |
Source: Public Records
Mortgage History
| Date | Status | Borrower | Loan Amount |
|---|---|---|---|
| Open | Robinson Timothy S | $256,000 | |
| Previous Owner | Hatcher Kevin R | $282,977 | |
| Previous Owner | Hatcher Kevin R | $278,797 | |
| Previous Owner | Hatcher Kevin R | $278,797 |
Source: Public Records
Tax History Compared to Growth
Tax History
| Year | Tax Paid | Tax Assessment Tax Assessment Total Assessment is a certain percentage of the fair market value that is determined by local assessors to be the total taxable value of land and additions on the property. | Land | Improvement |
|---|---|---|---|---|
| 2024 | $3,649 | $321,667 | $0 | $0 |
| 2023 | $3,016 | $313,433 | $0 | $0 |
| 2022 | $3,319 | $305,200 | $211,600 | $93,600 |
| 2021 | $6,516 | $294,233 | $0 | $0 |
| 2020 | $3,158 | $283,267 | $0 | $0 |
| 2019 | $3,101 | $272,300 | $181,600 | $90,700 |
| 2018 | $2,641 | $260,433 | $0 | $0 |
| 2017 | $2,911 | $248,567 | $0 | $0 |
| 2016 | -- | $236,700 | $0 | $0 |
| 2015 | -- | $234,367 | $0 | $0 |
| 2014 | -- | $232,033 | $0 | $0 |
Source: Public Records
Map
Nearby Homes
- 624 Evergreen Rd
- 610 Echo Cove Dr
- 801 Homestead Ln
- 658 Echo Cove Dr
- 1126 Severnview Dr
- 1146 Severnview Dr
- 616 Lakeland Rd S
- 1025 Tudor Dr
- 506 Pinefield Dr
- 416 Holly Farms Rd
- 1000 Tudor Dr
- 28 Holly Rd
- 2 Windward Dr
- 602 Knollwood Rd
- 404 Ben Oaks Dr W
- 693 Wellerburn Ave
- 1036 Omar Dr
- 604 Hidden Pond Ln
- 327 Lazywood Ct
- 1013 Waterbury Heights Dr