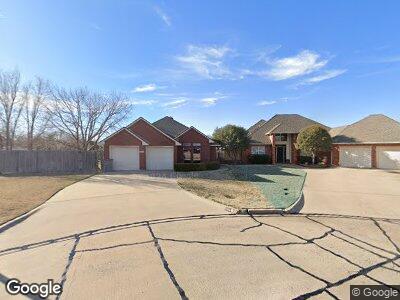
608 NW Waterford Dr Lawton, OK 73505
Estimated Value: $221,181 - $230,000
3
Beds
2
Baths
1,800
Sq Ft
$125/Sq Ft
Est. Value
About This Home
This home is located at 608 NW Waterford Dr, Lawton, OK 73505 and is currently estimated at $225,545, approximately $125 per square foot. 608 NW Waterford Dr is a home located in Comanche County with nearby schools including Adams Elementary School, Tomlinson Middle School, and Lawton High School.
Ownership History
Date
Name
Owned For
Owner Type
Purchase Details
Closed on
Jan 28, 2025
Sold by
Foster James H and Foster Glenda D
Bought by
Singleton Nickie and Singleton Gary
Current Estimated Value
Home Financials for this Owner
Home Financials are based on the most recent Mortgage that was taken out on this home.
Original Mortgage
$213,760
Outstanding Balance
$213,760
Interest Rate
6.72%
Mortgage Type
New Conventional
Estimated Equity
$11,785
Purchase Details
Closed on
Nov 20, 2012
Sold by
Pace Shirley R
Bought by
Foster James H and Foster Glenda D
Purchase Details
Closed on
Apr 6, 2010
Sold by
Rezaei Abolghasem M and Hernandez Amalia
Bought by
Pace Shirley A
Purchase Details
Closed on
Jul 15, 2005
Sold by
Hogan Aurthor S and Hogan Victoria M
Bought by
Rezael Abolghasem M and Hernandez Amalia
Purchase Details
Closed on
Dec 24, 1998
Sold by
Wisdom William E
Purchase Details
Closed on
Jun 5, 1995
Sold by
Wisdom William E and Wisdom Geraldine A
Create a Home Valuation Report for This Property
The Home Valuation Report is an in-depth analysis detailing your home's value as well as a comparison with similar homes in the area
Home Values in the Area
Average Home Value in this Area
Purchase History
| Date | Buyer | Sale Price | Title Company |
|---|---|---|---|
| Singleton Nickie | $225,000 | Title & Closing | |
| Foster James H | $192,000 | None Available | |
| Pace Shirley A | $182,000 | -- | |
| Rezael Abolghasem M | $160,000 | -- | |
| -- | $112,000 | -- | |
| -- | -- | -- |
Source: Public Records
Mortgage History
| Date | Status | Borrower | Loan Amount |
|---|---|---|---|
| Open | Singleton Nickie | $213,760 | |
| Previous Owner | Pace Shirley R | $15,000 |
Source: Public Records
Tax History Compared to Growth
Tax History
| Year | Tax Paid | Tax Assessment Tax Assessment Total Assessment is a certain percentage of the fair market value that is determined by local assessors to be the total taxable value of land and additions on the property. | Land | Improvement |
|---|---|---|---|---|
| 2024 | $2,170 | $21,058 | $3,390 | $17,668 |
| 2023 | $2,170 | $19,101 | $2,250 | $16,851 |
| 2022 | $2,036 | $19,101 | $2,250 | $16,851 |
| 2021 | $1,925 | $18,807 | $2,250 | $16,557 |
| 2020 | $1,892 | $18,612 | $2,250 | $16,362 |
| 2019 | $1,900 | $18,819 | $2,250 | $16,569 |
| 2018 | $1,936 | $19,441 | $2,250 | $17,191 |
| 2017 | $1,735 | $20,269 | $2,250 | $18,019 |
| 2016 | $1,729 | $19,665 | $2,250 | $17,415 |
| 2015 | $1,929 | $21,581 | $1,688 | $19,893 |
| 2014 | $1,911 | $21,581 | $1,688 | $19,893 |
Source: Public Records
Map
Nearby Homes
- 602 NW Waterford Dr
- 516 NW 27th St
- 2610 NW Wesley Ave
- 406 NW 30th St
- 702 NW 31st St
- 2905 NW Templeton Terrace
- 2916 NW Templeton Terrace
- 602 NW 31st St
- 2911 NW Templeton Terrace
- 407 NW 32nd St
- 33 NW 28th St
- 823 NW 31st St
- 43 NW 25th St
- 308 NW 32nd St
- 734 NW 32nd St
- 825 NW 33rd St
- 306 NW 32nd St
- 17 NW 28th St
- 2105 NW Columbia Ave
- 31 NW 24th St