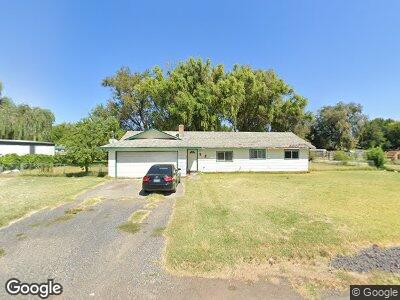
610 E Harding Ave Stanfield, OR 97875
Estimated Value: $202,000 - $296,000
3
Beds
2
Baths
1,320
Sq Ft
$200/Sq Ft
Est. Value
About This Home
This home is located at 610 E Harding Ave, Stanfield, OR 97875 and is currently estimated at $264,204, approximately $200 per square foot. 610 E Harding Ave is a home located in Umatilla County with nearby schools including Stanfield Elementary School and Stanfield Secondary School.
Ownership History
Date
Name
Owned For
Owner Type
Purchase Details
Closed on
Mar 31, 2010
Sold by
Lsf6 Mercury Reo Investments Trust Serie
Bought by
Bishop Kristopher S
Current Estimated Value
Home Financials for this Owner
Home Financials are based on the most recent Mortgage that was taken out on this home.
Original Mortgage
$78,449
Outstanding Balance
$54,514
Interest Rate
5.5%
Mortgage Type
FHA
Estimated Equity
$218,040
Purchase Details
Closed on
Nov 24, 2009
Sold by
Lopez Armando
Bought by
Lsf6 Mercury Reo Investments Trust Serie
Purchase Details
Closed on
May 16, 2005
Sold by
Tibbs Russell M
Bought by
Lopez Armando
Home Financials for this Owner
Home Financials are based on the most recent Mortgage that was taken out on this home.
Original Mortgage
$25,000
Interest Rate
5.45%
Mortgage Type
Stand Alone Second
Create a Home Valuation Report for This Property
The Home Valuation Report is an in-depth analysis detailing your home's value as well as a comparison with similar homes in the area
Home Values in the Area
Average Home Value in this Area
Purchase History
| Date | Buyer | Sale Price | Title Company |
|---|---|---|---|
| Bishop Kristopher S | $79,900 | Amerititle | |
| Lsf6 Mercury Reo Investments Trust Serie | $86,874 | Pioneer Title Co | |
| Lopez Armando | $104,950 | Pioneer Title Co |
Source: Public Records
Mortgage History
| Date | Status | Borrower | Loan Amount |
|---|---|---|---|
| Open | Bishop Kristopher S | $6,417 | |
| Open | Bishop Kristopher S | $78,449 | |
| Previous Owner | Lopez Armando | $25,000 | |
| Previous Owner | Lopez Armando | $79,950 |
Source: Public Records
Tax History Compared to Growth
Tax History
| Year | Tax Paid | Tax Assessment Tax Assessment Total Assessment is a certain percentage of the fair market value that is determined by local assessors to be the total taxable value of land and additions on the property. | Land | Improvement |
|---|---|---|---|---|
| 2024 | $2,288 | $144,250 | $29,300 | $114,950 |
| 2023 | $2,263 | $140,050 | $28,450 | $111,600 |
| 2022 | $2,136 | $135,980 | $0 | $0 |
| 2021 | $2,120 | $132,020 | $26,810 | $105,210 |
| 2020 | $2,048 | $128,180 | $26,030 | $102,150 |
| 2018 | $1,894 | $120,830 | $24,530 | $96,300 |
| 2017 | $1,873 | $117,640 | $26,410 | $91,230 |
| 2016 | $1,728 | $114,220 | $25,640 | $88,580 |
| 2015 | $1,772 | $104,540 | $23,460 | $81,080 |
| 2014 | $1,632 | $104,540 | $23,460 | $81,080 |
Source: Public Records
Map
Nearby Homes
- 525 E Harding Ave
- 805 N Howard St
- 150 S Earl Ct
- 165 E Furnish Ave
- 190 W Ball Ave
- 680 Tinley St
- 720 Tinley St
- 0 Hwy 395 Unit 768426041
- 795 Tinley St
- 815 Tinley St
- 785 Tinley St
- 850 Tinley St
- 805 Tinley St
- 615 Tinley St
- 605 Tinley St
- 600 Tinley St
- 405 Hoosier Rd
- 000 395 and Canal
- 225 Rosalynn Dr
- 0 Stanfield Ave