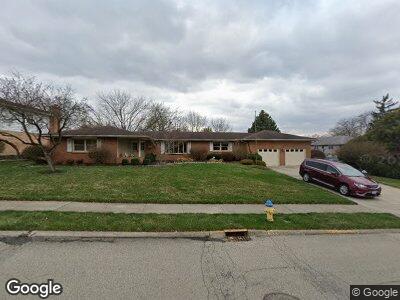
611 Torrence Dr Springfield, OH 45503
Estimated Value: $252,734 - $287,000
3
Beds
3
Baths
2,366
Sq Ft
$115/Sq Ft
Est. Value
About This Home
This home is located at 611 Torrence Dr, Springfield, OH 45503 and is currently estimated at $272,684, approximately $115 per square foot. 611 Torrence Dr is a home located in Clark County with nearby schools including Kenton Elementary School, Roosevelt Middle School, and Springfield High School.
Ownership History
Date
Name
Owned For
Owner Type
Purchase Details
Closed on
Sep 6, 2007
Sold by
Morgan Albert M and Morgan Mary Ann
Bought by
Morgan Albert M and Morgan Mary Ann
Current Estimated Value
Create a Home Valuation Report for This Property
The Home Valuation Report is an in-depth analysis detailing your home's value as well as a comparison with similar homes in the area
Home Values in the Area
Average Home Value in this Area
Purchase History
| Date | Buyer | Sale Price | Title Company |
|---|---|---|---|
| Morgan Albert M | -- | None Available |
Source: Public Records
Mortgage History
| Date | Status | Borrower | Loan Amount |
|---|---|---|---|
| Closed | Morgan Albert M | $100,000 | |
| Closed | Morgan Albert M | $30,000 |
Source: Public Records
Tax History Compared to Growth
Tax History
| Year | Tax Paid | Tax Assessment Tax Assessment Total Assessment is a certain percentage of the fair market value that is determined by local assessors to be the total taxable value of land and additions on the property. | Land | Improvement |
|---|---|---|---|---|
| 2024 | $3,072 | $63,750 | $16,100 | $47,650 |
| 2023 | $3,072 | $63,750 | $16,100 | $47,650 |
| 2022 | $2,715 | $63,750 | $16,100 | $47,650 |
| 2021 | $2,401 | $53,660 | $13,090 | $40,570 |
| 2020 | $2,407 | $53,660 | $13,090 | $40,570 |
| 2019 | $2,413 | $53,660 | $13,090 | $40,570 |
| 2018 | $2,337 | $50,540 | $10,310 | $40,230 |
| 2017 | $2,336 | $52,476 | $10,308 | $42,168 |
| 2016 | $2,339 | $52,476 | $10,308 | $42,168 |
| 2015 | $2,289 | $47,426 | $9,818 | $37,608 |
| 2014 | $2,279 | $47,426 | $9,818 | $37,608 |
| 2013 | $2,254 | $47,426 | $9,818 | $37,608 |
Source: Public Records
Map
Nearby Homes
- 2900 Balsam Dr
- 2437 Red Coach Dr Unit 4
- 2431 Red Coach Dr
- 2831 Wellsford Ln
- 2831 Wellsford Dr
- 800 Medford Dr
- 543 Argonne Ave Unit 543
- 2639 Home Orchard Dr
- 1062 Imperial Blvd
- 615 Villa Rd Unit D
- 327 Villa Rd
- 645 Villa Rd Unit A
- 3131 El Camino Dr Unit 2
- 2408 Balsam Dr
- 647 Villa Rd Unit A
- 1034 Eastgate Rd
- 2430 Northmoor Dr
- 2351 Northmoor Dr
- 1405 Providence Ave
- 1337 Eastgate Rd