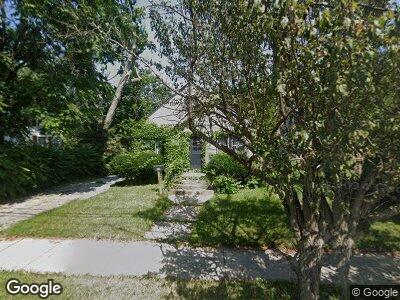
612 N Trumbull St Bay City, MI 48708
Center Avenue Historic District NeighborhoodEstimated Value: $117,556 - $125,000
2
Beds
1
Bath
1,056
Sq Ft
$116/Sq Ft
Est. Value
About This Home
This home is located at 612 N Trumbull St, Bay City, MI 48708 and is currently estimated at $122,389, approximately $115 per square foot. 612 N Trumbull St is a home located in Bay County with nearby schools including Washington Elementary School, Handy Middle School, and Bay City Central High School.
Ownership History
Date
Name
Owned For
Owner Type
Purchase Details
Closed on
Jul 7, 2021
Sold by
Jjrs Llc
Bought by
Maetro John and Maetro Stepahnie
Current Estimated Value
Purchase Details
Closed on
Feb 28, 2020
Sold by
Sepos Angela C
Bought by
Jankoska Ryan
Purchase Details
Closed on
Apr 27, 2009
Sold by
Edsall Michael K
Bought by
Sepos Angela C
Purchase Details
Closed on
Dec 3, 2008
Sold by
Edsall Howard G
Bought by
Edsall Michael K
Purchase Details
Closed on
Jun 30, 2008
Sold by
Chrobak Jadwiga
Bought by
Edsall Howard G
Purchase Details
Closed on
Aug 30, 2004
Sold by
Chrobak Stanley
Bought by
Chrobak Jadwiga
Purchase Details
Closed on
Oct 13, 1997
Sold by
Chrobak Stanley J and Chrobak Jadwiga
Bought by
Edsall Howard G
Create a Home Valuation Report for This Property
The Home Valuation Report is an in-depth analysis detailing your home's value as well as a comparison with similar homes in the area
Home Values in the Area
Average Home Value in this Area
Purchase History
| Date | Buyer | Sale Price | Title Company |
|---|---|---|---|
| Maetro John | -- | None Available | |
| Jankoska Ryan | $10,704 | None Available | |
| Sepos Angela C | -- | None Available | |
| Edsall Howard G | $37,000 | None Available | |
| Chrobak Jadwiga | -- | -- | |
| Edsall Howard G | $37,000 | -- |
Source: Public Records
Mortgage History
| Date | Status | Borrower | Loan Amount |
|---|---|---|---|
| Previous Owner | Sepos Angela | $7,227 |
Source: Public Records
Tax History Compared to Growth
Tax History
| Year | Tax Paid | Tax Assessment Tax Assessment Total Assessment is a certain percentage of the fair market value that is determined by local assessors to be the total taxable value of land and additions on the property. | Land | Improvement |
|---|---|---|---|---|
| 2024 | $1,943 | $44,600 | $0 | $0 |
| 2023 | $1,850 | $36,800 | $0 | $0 |
| 2022 | $2,026 | $31,200 | $0 | $0 |
| 2021 | $1,982 | $29,750 | $29,750 | $0 |
| 2020 | $1,694 | $26,900 | $26,900 | $0 |
| 2019 | $2,903 | $26,200 | $0 | $0 |
| 2018 | $1,260 | $25,650 | $0 | $0 |
| 2017 | $1,254 | $25,550 | $0 | $0 |
| 2016 | $1,261 | $25,600 | $0 | $25,600 |
| 2015 | $1,471 | $25,650 | $0 | $25,650 |
| 2014 | $1,471 | $30,900 | $0 | $30,900 |
Source: Public Records
Map
Nearby Homes
- 2121 7th St
- 2123 5th St
- 620 N Johnson St
- 1906 10th St
- 820 N Johnson St
- 2151 4th St
- 105 Parkwood Ct
- 2131 3rd St
- 1315 Mckinley Ave
- 1614 11th St
- 1518 11th St
- 1213 Center Ave
- 405 Harvard St
- 908 N Sherman St
- 1101 Mckinley Ave
- 208 N Sheridan St
- 406 Princeton St
- 400 S Johnson St
- 302 N Farragut St
- 609 Fillmore Place