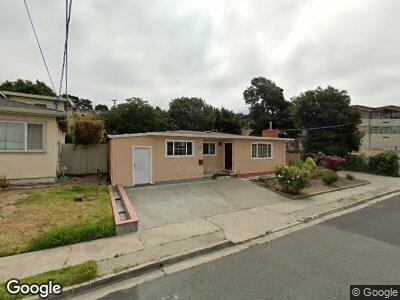
6125 Rosalind Ave Richmond, CA 94805
East Richmond Heights NeighborhoodEstimated Value: $653,000 - $881,000
3
Beds
1
Bath
1,227
Sq Ft
$609/Sq Ft
Est. Value
About This Home
This home is located at 6125 Rosalind Ave, Richmond, CA 94805 and is currently estimated at $747,724, approximately $609 per square foot. 6125 Rosalind Ave is a home located in Contra Costa County with nearby schools including Mira Vista Elementary School, Fred T. Korematsu Middle School, and El Cerrito Senior High School.
Ownership History
Date
Name
Owned For
Owner Type
Purchase Details
Closed on
Apr 18, 2013
Sold by
Santos Joel and Santos Patricia
Bought by
Santos Joel
Current Estimated Value
Purchase Details
Closed on
Jul 29, 2005
Sold by
Ryan Anthony and Ryan Charlotte
Bought by
Santos Joel and Santos Patricia
Home Financials for this Owner
Home Financials are based on the most recent Mortgage that was taken out on this home.
Original Mortgage
$371,250
Outstanding Balance
$205,599
Interest Rate
5.46%
Mortgage Type
Stand Alone First
Estimated Equity
$578,386
Purchase Details
Closed on
Jul 29, 2004
Sold by
Travis Darline S and Ryan Anthony
Bought by
Ryan Anthony and Ryan Charlotte
Home Financials for this Owner
Home Financials are based on the most recent Mortgage that was taken out on this home.
Original Mortgage
$195,000
Interest Rate
6.24%
Mortgage Type
Stand Alone Refi Refinance Of Original Loan
Purchase Details
Closed on
Sep 27, 2003
Sold by
Travis Ralph and Travis Darline S
Bought by
Travis Ralph and Travis Darline S
Create a Home Valuation Report for This Property
The Home Valuation Report is an in-depth analysis detailing your home's value as well as a comparison with similar homes in the area
Home Values in the Area
Average Home Value in this Area
Purchase History
| Date | Buyer | Sale Price | Title Company |
|---|---|---|---|
| Santos Joel | -- | None Available | |
| Santos Joel | $495,000 | First American Title | |
| Ryan Anthony | -- | Fidelity National Title | |
| Travis Ralph | -- | -- |
Source: Public Records
Mortgage History
| Date | Status | Borrower | Loan Amount |
|---|---|---|---|
| Open | Santos Joel | $371,250 | |
| Previous Owner | Ryan Anthony R | $125,000 | |
| Previous Owner | Ryan Anthony | $195,000 | |
| Previous Owner | Travis Ralph | $107,000 |
Source: Public Records
Tax History Compared to Growth
Tax History
| Year | Tax Paid | Tax Assessment Tax Assessment Total Assessment is a certain percentage of the fair market value that is determined by local assessors to be the total taxable value of land and additions on the property. | Land | Improvement |
|---|---|---|---|---|
| 2024 | $9,469 | $663,179 | $542,070 | $121,109 |
| 2023 | $9,469 | $650,177 | $531,442 | $118,735 |
| 2022 | $9,345 | $637,429 | $521,022 | $116,407 |
| 2021 | $9,316 | $624,931 | $510,806 | $114,125 |
| 2019 | $8,785 | $606,397 | $495,656 | $110,741 |
| 2018 | $7,702 | $534,500 | $436,889 | $97,611 |
| 2017 | $7,513 | $523,000 | $427,488 | $95,512 |
| 2016 | $7,257 | $499,000 | $407,871 | $91,129 |
| 2015 | $6,273 | $417,500 | $341,255 | $76,245 |
| 2014 | $5,321 | $342,000 | $279,543 | $62,457 |
Source: Public Records
Map
Nearby Homes
- 5631 Doremus Ave
- 6104 Bernhard Ave
- 6062 Bernhard Ave
- 6315 Arlington Blvd
- 5955 Ralston Ave
- 6028 Mcbryde Ave
- 612 Sonoma St
- 766 Ventura St
- 5841 Arlington Blvd
- 6425 Kensington Ave
- 636 Humboldt St
- 2638 Tuller Ave
- 1253 Gerald Ave
- 4000 Solano Ave
- 637 43rd St
- 715 40th St
- 495 Key Blvd
- 2509 Tulare Ave
- 2536 Carquinez Ave
- 0 Fairview Ave Unit 41085098