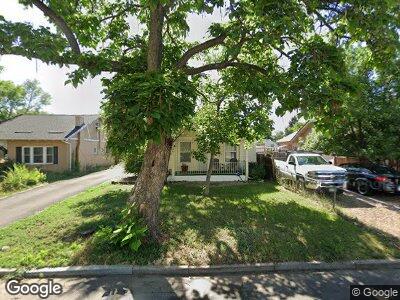
613 Newton St Denver, CO 80204
Villa Park NeighborhoodEstimated Value: $404,000 - $453,000
2
Beds
1
Bath
1,374
Sq Ft
$312/Sq Ft
Est. Value
About This Home
This home is located at 613 Newton St, Denver, CO 80204 and is currently estimated at $428,657, approximately $311 per square foot. 613 Newton St is a home located in Denver County with nearby schools including Eagleton Elementary School, Lake Middle School, and North High School.
Ownership History
Date
Name
Owned For
Owner Type
Purchase Details
Closed on
May 5, 2009
Sold by
Thomas Shelley T and Thomas Suzanne P
Bought by
Hight Kathleen B
Current Estimated Value
Home Financials for this Owner
Home Financials are based on the most recent Mortgage that was taken out on this home.
Original Mortgage
$126,155
Interest Rate
4.84%
Mortgage Type
Purchase Money Mortgage
Purchase Details
Closed on
Oct 2, 2008
Sold by
Hud
Bought by
Thomas Shelley T and Thomas Suzanne P
Purchase Details
Closed on
Feb 29, 2008
Sold by
Zarirana Pablo and Zarirana Annabelle
Bought by
Hud
Purchase Details
Closed on
Apr 12, 2007
Sold by
Zarinana Paublo and Salazar Annabelle
Bought by
Zarinana Paublo
Purchase Details
Closed on
Sep 29, 2005
Sold by
Olson David F and Olson Sharon S
Bought by
Zarinana Pablo and Salazar Annabelle
Home Financials for this Owner
Home Financials are based on the most recent Mortgage that was taken out on this home.
Original Mortgage
$5,000
Interest Rate
6%
Mortgage Type
Purchase Money Mortgage
Create a Home Valuation Report for This Property
The Home Valuation Report is an in-depth analysis detailing your home's value as well as a comparison with similar homes in the area
Home Values in the Area
Average Home Value in this Area
Purchase History
| Date | Buyer | Sale Price | Title Company |
|---|---|---|---|
| Hight Kathleen B | $126,155 | Fahtco | |
| Thomas Shelley T | -- | Ats | |
| Hud | -- | None Available | |
| Zarinana Paublo | -- | None Available | |
| Zarinana Pablo | $141,000 | -- |
Source: Public Records
Mortgage History
| Date | Status | Borrower | Loan Amount |
|---|---|---|---|
| Open | Herndon Kasey | $262,000 | |
| Closed | Herndon Kasey | $215,000 | |
| Closed | Herndon Kasey | $210,000 | |
| Closed | Herndon Kasey | $181,600 | |
| Closed | Hight Kathleen B | $126,155 | |
| Previous Owner | Zarinana Pablo | $5,000 |
Source: Public Records
Tax History Compared to Growth
Tax History
| Year | Tax Paid | Tax Assessment Tax Assessment Total Assessment is a certain percentage of the fair market value that is determined by local assessors to be the total taxable value of land and additions on the property. | Land | Improvement |
|---|---|---|---|---|
| 2024 | $2,304 | $29,090 | $14,180 | $14,910 |
| 2023 | $2,254 | $29,090 | $14,180 | $14,910 |
| 2022 | $2,003 | $25,190 | $9,200 | $15,990 |
| 2021 | $1,934 | $25,920 | $9,470 | $16,450 |
| 2020 | $1,659 | $22,360 | $8,050 | $14,310 |
| 2019 | $1,613 | $22,360 | $8,050 | $14,310 |
| 2018 | $1,233 | $15,940 | $6,400 | $9,540 |
| 2017 | $1,230 | $15,940 | $6,400 | $9,540 |
| 2016 | $829 | $10,170 | $3,534 | $6,636 |
| 2015 | $795 | $10,170 | $3,534 | $6,636 |
| 2014 | $635 | $7,640 | $1,887 | $5,753 |
Source: Public Records
Map
Nearby Homes