
Seller's Agent in 2024
Tom Whitney
Long & Foster
(703) 582-6181
2 in this area
72 Total Sales
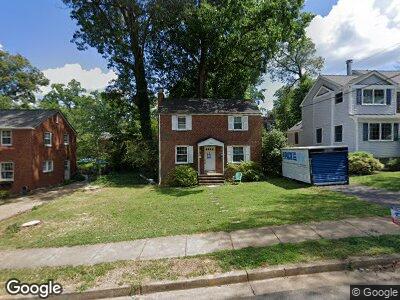
Introducing 6134 11th Rd N, in a fabulous neighborhood in coveted Arlington, VA 22205. Along with its fresh paint, it also features new plumbing, electrical systems, and blinds throughout. The dedicated dining room leads to the renovated kitchen, with dark cherry cabinets, upgraded countertops, LVP flooring, and stainless steel appliances. The kitchen opens to a side yard and patio for outdoor dining with an expansive backyard beyond it. Currently, only partially fenced, but the owner will consider fully fencing the backyard in. Upstairs, you'll find 2 good sized bedrooms and a full bathroom with new tile and a reglazed tub. The finished basement includes new lighting, a full-sized washer and dryer, as well as a rec room. This home is less than 1 mile from East Falls Church Metro Station, shops, restaurants, and Madison Manor Park. Available 9/1/24 for a 1-year lease.
| Date | Buyer | Sale Price | Title Company |
|---|---|---|---|
| Ter Huerne Erwin | $978,700 | Title Resource Guaranty Compan |
| Date | Event | Price | Change | Sq Ft Price |
|---|---|---|---|---|
| 09/03/2024 09/03/24 | Rented | $3,600 | 0.0% | -- |
| 08/31/2024 08/31/24 | Under Contract | -- | -- | -- |
| 08/28/2024 08/28/24 | Price Changed | $3,600 | -10.0% | $3 / Sq Ft |
| 08/23/2024 08/23/24 | For Rent | $4,000 | 0.0% | -- |
| 07/30/2024 07/30/24 | Sold | $978,700 | +6.7% | $874 / Sq Ft |
| 07/15/2024 07/15/24 | Pending | -- | -- | -- |
| 07/11/2024 07/11/24 | For Sale | $917,000 | 0.0% | $819 / Sq Ft |
| 01/26/2023 01/26/23 | Rented | $3,007 | 0.0% | -- |
| 11/29/2022 11/29/22 | For Rent | $3,007 | +3.8% | -- |
| 10/18/2021 10/18/21 | Rented | $2,897 | 0.0% | -- |
| 10/12/2021 10/12/21 | Price Changed | $2,897 | -3.3% | $3 / Sq Ft |
| 10/08/2021 10/08/21 | For Rent | $2,997 | -- | -- |
| Year | Tax Paid | Tax Assessment Tax Assessment Total Assessment is a certain percentage of the fair market value that is determined by local assessors to be the total taxable value of land and additions on the property. | Land | Improvement |
|---|---|---|---|---|
| 2024 | $8,353 | $808,600 | $699,200 | $109,400 |
| 2023 | $8,272 | $803,100 | $699,200 | $103,900 |
| 2022 | $8,014 | $778,100 | $674,200 | $103,900 |
| 2021 | $7,325 | $711,200 | $615,000 | $96,200 |
| 2020 | $6,989 | $681,200 | $585,000 | $96,200 |
| 2019 | $6,780 | $660,800 | $560,000 | $100,800 |
| 2018 | $6,628 | $658,800 | $540,000 | $118,800 |
| 2017 | $6,185 | $614,800 | $510,000 | $104,800 |
| 2016 | $6,084 | $613,900 | $490,000 | $123,900 |
| 2015 | $6,109 | $613,400 | $480,000 | $133,400 |
| 2014 | $5,942 | $596,600 | $455,000 | $141,600 |
Seller's Agent in 2024
Tom Whitney
Long & Foster
(703) 582-6181
2 in this area
72 Total Sales
Seller's Agent in 2024
Dylan Lewis
Hometown Realty Services, Inc.
(540) 848-1692
1 in this area
10 Total Sales
T
Buyer's Agent in 2024
Tori Eger
Compass
(252) 573-1281
6 Total Sales
Seller's Agent in 2023
Sharon Cail
Bay Property Mgmt Group Northern Virginia, LLC.
(703) 843-6495
8 Total Sales
Seller's Agent in 2021
Tara Winfree
Bay Property Mgmt Group Northern Virginia, LLC.