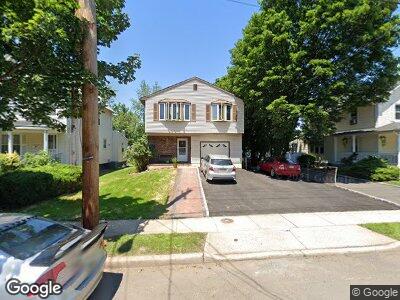
617 E 3rd St Unit 19 Plainfield, NJ 07060
Estimated Value: $463,000 - $581,000
--
Bed
--
Bath
1,932
Sq Ft
$271/Sq Ft
Est. Value
About This Home
This home is located at 617 E 3rd St Unit 19, Plainfield, NJ 07060 and is currently estimated at $522,680, approximately $270 per square foot. 617 E 3rd St Unit 19 is a home located in Union County with nearby schools including Dewitt D. Barlow Elementary School, Maxson Middle School, and Plainfield High School.
Ownership History
Date
Name
Owned For
Owner Type
Purchase Details
Closed on
Feb 22, 2007
Sold by
Brown Laquila Stembridge
Bought by
Donmartin Annette
Current Estimated Value
Home Financials for this Owner
Home Financials are based on the most recent Mortgage that was taken out on this home.
Original Mortgage
$244,000
Outstanding Balance
$154,898
Interest Rate
6.27%
Estimated Equity
$382,279
Purchase Details
Closed on
Aug 31, 2000
Sold by
Diggs James and Diggs Joan
Bought by
Carlton Stembridge Brown Laquila and Carlton Rudolph
Home Financials for this Owner
Home Financials are based on the most recent Mortgage that was taken out on this home.
Original Mortgage
$125,920
Interest Rate
8.1%
Mortgage Type
FHA
Purchase Details
Closed on
Feb 14, 1995
Sold by
Federal National Mortgage Association
Bought by
Diggs James
Purchase Details
Closed on
Oct 7, 1994
Sold by
Froehlich Ralph
Bought by
Federal National Mortgage Association
Create a Home Valuation Report for This Property
The Home Valuation Report is an in-depth analysis detailing your home's value as well as a comparison with similar homes in the area
Home Values in the Area
Average Home Value in this Area
Purchase History
| Date | Buyer | Sale Price | Title Company |
|---|---|---|---|
| Donmartin Annette | $305,000 | -- | |
| Carlton Stembridge Brown Laquila | $127,000 | -- | |
| Diggs James | $108,000 | -- | |
| Federal National Mortgage Association | -- | -- |
Source: Public Records
Mortgage History
| Date | Status | Borrower | Loan Amount |
|---|---|---|---|
| Open | Donmartin Annette | $244,000 | |
| Previous Owner | Rudloph Carlton | $178,900 | |
| Previous Owner | Carlton Stembridge Brown Laquila | $125,920 |
Source: Public Records
Tax History Compared to Growth
Tax History
| Year | Tax Paid | Tax Assessment Tax Assessment Total Assessment is a certain percentage of the fair market value that is determined by local assessors to be the total taxable value of land and additions on the property. | Land | Improvement |
|---|---|---|---|---|
| 2024 | $10,808 | $125,000 | $40,400 | $84,600 |
| 2023 | $10,808 | $125,000 | $40,400 | $84,600 |
| 2022 | $10,574 | $125,000 | $40,400 | $84,600 |
| 2021 | $10,481 | $125,000 | $40,400 | $84,600 |
| 2020 | $10,451 | $125,000 | $40,400 | $84,600 |
| 2019 | $10,451 | $125,000 | $40,400 | $84,600 |
| 2018 | $10,233 | $125,000 | $40,400 | $84,600 |
| 2017 | $9,983 | $125,000 | $40,400 | $84,600 |
| 2016 | $9,779 | $125,000 | $40,400 | $84,600 |
| 2015 | $9,490 | $125,000 | $40,400 | $84,600 |
| 2014 | $9,233 | $125,000 | $40,400 | $84,600 |
Source: Public Records
Map
Nearby Homes
- 612 E 2nd St
- 141 Berckman St Unit 43
- 137 Berckman St
- 329 Berckman St
- 708 E Front St
- 317 Richmond St
- 707 Richmond St
- 32-38 Norwood Ave Unit 3
- 402-4 E 2nd St
- 400 E Front St Unit 215
- 821 George St
- 717 E 6th St
- 722 E 6th St Unit 24
- 844 George St Unit 46
- 358-400 E 2nd St
- 736 E 7th St Unit 38
- 258 N Jackson Ave
- 241 N Jackson Ave
- 275-79 Garfield Ave
- 1213 Putnam Ave Unit 15