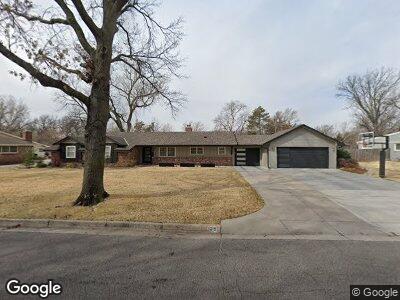
619 N Mission Rd Wichita, KS 67206
Woodlawn Village NeighborhoodEstimated Value: $344,000 - $401,061
3
Beds
3
Baths
2,068
Sq Ft
$180/Sq Ft
Est. Value
About This Home
This home is located at 619 N Mission Rd, Wichita, KS 67206 and is currently estimated at $372,531, approximately $180 per square foot. 619 N Mission Rd is a home located in Sedgwick County with nearby schools including Price-Harris Communications Magnet Elementary School, Coleman Environmental Magnet Middle School, and Wichita Southeast High School.
Ownership History
Date
Name
Owned For
Owner Type
Purchase Details
Closed on
Nov 17, 2017
Sold by
Patterson Jeremy A and Patterson Emily A
Bought by
Patterson Jeremy A and Patterson Emily A
Current Estimated Value
Home Financials for this Owner
Home Financials are based on the most recent Mortgage that was taken out on this home.
Original Mortgage
$196,800
Outstanding Balance
$169,766
Interest Rate
3.91%
Mortgage Type
New Conventional
Estimated Equity
$224,060
Purchase Details
Closed on
Jul 1, 2011
Sold by
Squires C Patrick
Bought by
Patterson Jeremy A and Patterson Emily A
Home Financials for this Owner
Home Financials are based on the most recent Mortgage that was taken out on this home.
Original Mortgage
$160,000
Interest Rate
4.65%
Mortgage Type
New Conventional
Purchase Details
Closed on
Feb 26, 2001
Sold by
Rowe Mark C and Rowe Karen K
Bought by
Squires C Patrick
Create a Home Valuation Report for This Property
The Home Valuation Report is an in-depth analysis detailing your home's value as well as a comparison with similar homes in the area
Home Values in the Area
Average Home Value in this Area
Purchase History
| Date | Buyer | Sale Price | Title Company |
|---|---|---|---|
| Patterson Jeremy A | -- | None Available | |
| Patterson Jeremy A | -- | Security 1St Title | |
| Squires C Patrick | -- | Security Abstract & Title Co |
Source: Public Records
Mortgage History
| Date | Status | Borrower | Loan Amount |
|---|---|---|---|
| Open | Patterson Jeremy A | $196,800 | |
| Closed | Patterson Jeremy A | $160,000 | |
| Previous Owner | Squires Patrick C | $2,500 |
Source: Public Records
Tax History Compared to Growth
Tax History
| Year | Tax Paid | Tax Assessment Tax Assessment Total Assessment is a certain percentage of the fair market value that is determined by local assessors to be the total taxable value of land and additions on the property. | Land | Improvement |
|---|---|---|---|---|
| 2023 | $4,499 | $40,791 | $6,164 | $34,627 |
| 2022 | $4,256 | $37,697 | $5,819 | $31,878 |
| 2021 | $4,016 | $34,903 | $3,692 | $31,211 |
| 2020 | $3,875 | $33,558 | $3,692 | $29,866 |
| 2019 | $3,624 | $31,361 | $3,692 | $27,669 |
| 2018 | $2,896 | $25,047 | $2,162 | $22,885 |
| 2017 | $2,706 | $0 | $0 | $0 |
| 2016 | $2,703 | $0 | $0 | $0 |
| 2015 | $2,677 | $0 | $0 | $0 |
| 2014 | $2,622 | $0 | $0 | $0 |
Source: Public Records
Map
Nearby Homes
- 548 N Brookfield St
- 334 N Hampton Rd
- 6504 E Murdock St
- 7077 E Central Ave
- 6412 E Claytonia St
- 6427 E Marjorie St
- 6411 E Marjorie St
- 641 N Woodlawn Blvd
- 334 N Colonial Place
- 6519 E Jacqueline St
- 673 N Broadmoor Ave
- 6427 E Jacqueline St
- 7423 E Plaza Ln
- 64 E Norfolk Dr
- 40 E Norfolk Dr
- 6011 E Oakwood Dr
- 2 N Saint James Place
- 211 N Armour St
- 36 N Stratford Rd
- 520 N Broadmoor Ct