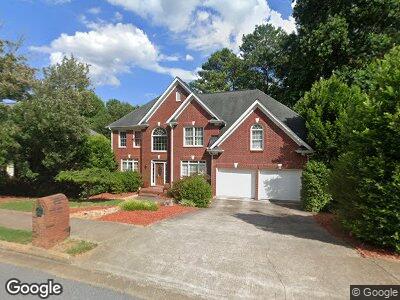
620 Saint Fillans Ct Alpharetta, GA 30022
Newtown NeighborhoodEstimated Value: $762,000 - $882,000
5
Beds
4
Baths
2,957
Sq Ft
$276/Sq Ft
Est. Value
About This Home
This home is located at 620 Saint Fillans Ct, Alpharetta, GA 30022 and is currently estimated at $815,494, approximately $275 per square foot. 620 Saint Fillans Ct is a home located in Fulton County with nearby schools including Barnwell Elementary School, Haynes Bridge Middle School, and Centennial High School.
Ownership History
Date
Name
Owned For
Owner Type
Purchase Details
Closed on
Jun 24, 1998
Sold by
Korenfeld Yakov
Bought by
Korenfeld Yakov
Current Estimated Value
Home Financials for this Owner
Home Financials are based on the most recent Mortgage that was taken out on this home.
Original Mortgage
$213,000
Interest Rate
7.04%
Mortgage Type
Stand Alone Refi Refinance Of Original Loan
Purchase Details
Closed on
May 26, 1995
Sold by
John Willis Homes
Bought by
Korenfeld Yakov Irina
Purchase Details
Closed on
Sep 14, 1994
Sold by
Cowart Jim Inc
Bought by
Willis John Homes Inc
Home Financials for this Owner
Home Financials are based on the most recent Mortgage that was taken out on this home.
Original Mortgage
$186,750
Interest Rate
8.37%
Mortgage Type
Construction
Create a Home Valuation Report for This Property
The Home Valuation Report is an in-depth analysis detailing your home's value as well as a comparison with similar homes in the area
Home Values in the Area
Average Home Value in this Area
Purchase History
| Date | Buyer | Sale Price | Title Company |
|---|---|---|---|
| Korenfeld Yakov | -- | -- | |
| Korenfeld Yakov Irina | $259,500 | -- | |
| Willis John Homes Inc | $43,900 | -- |
Source: Public Records
Mortgage History
| Date | Status | Borrower | Loan Amount |
|---|---|---|---|
| Closed | Korenfeld Yakov | $138,000 | |
| Closed | Korenfeld Yakov | $140,000 | |
| Closed | Korenfeld Yakov B | $150,000 | |
| Closed | Korenfeld Yakov | $100,000 | |
| Closed | Korenfeld Yakov | $224,000 | |
| Closed | Korenfeld Yakov | $225,000 | |
| Closed | Korenfeld Yakov | $74,800 | |
| Closed | Korenfeld Yakov | $46,000 | |
| Previous Owner | Korenfield Yakov | $213,000 | |
| Previous Owner | Korenfield Yakov | $212,500 | |
| Previous Owner | Willis John Homes Inc | $186,750 | |
| Closed | Willis John Homes Inc | $14,600 | |
| Closed | Korenfeld Yakov Irina | $0 |
Source: Public Records
Tax History Compared to Growth
Tax History
| Year | Tax Paid | Tax Assessment Tax Assessment Total Assessment is a certain percentage of the fair market value that is determined by local assessors to be the total taxable value of land and additions on the property. | Land | Improvement |
|---|---|---|---|---|
| 2023 | $7,348 | $260,320 | $85,880 | $174,440 |
| 2022 | $5,234 | $220,480 | $57,520 | $162,960 |
| 2021 | $5,184 | $183,880 | $46,880 | $137,000 |
| 2020 | $5,242 | $210,560 | $48,160 | $162,400 |
| 2019 | $628 | $192,640 | $42,880 | $149,760 |
| 2018 | $5,054 | $167,440 | $37,320 | $130,120 |
| 2017 | $5,153 | $163,560 | $33,080 | $130,480 |
| 2016 | $5,064 | $163,560 | $33,080 | $130,480 |
| 2015 | $5,118 | $163,560 | $33,080 | $130,480 |
| 2014 | $4,183 | $131,640 | $44,320 | $87,320 |
Source: Public Records
Map
Nearby Homes
- 9770 Rod Rd
- 3045 Hartridge Dr
- 3450 Merganser Ln
- 635 Holyrood Way
- 3213 Arborwoods Dr
- 815 Kings Arms Way Unit IV
- 3000 Leeds Garden Ln
- 3060 Birchton St
- 211 Meritage Dr
- 515 Old Chartwell Crossing
- 9680 Almaviva Dr
- 3105 Birchton St Unit 1
- 230 Winnipeg Ln
- 125 Stoney Ridge Dr
- 2870 Abbottswell Dr
- 3485 Aubusson Trace
- 2885 Arborwoods Dr