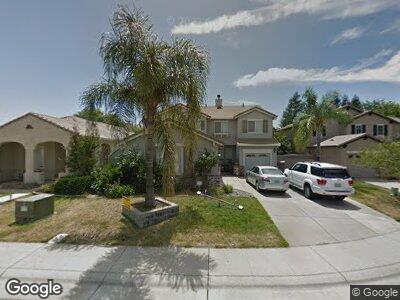
6221 King Elder Ct Rocklin, CA 95765
Sunset West NeighborhoodEstimated Value: $744,000 - $757,189
4
Beds
3
Baths
2,786
Sq Ft
$269/Sq Ft
Est. Value
About This Home
This home is located at 6221 King Elder Ct, Rocklin, CA 95765 and is currently estimated at $750,547, approximately $269 per square foot. 6221 King Elder Ct is a home located in Placer County with nearby schools including Ruhkala Elementary School, Spring View Middle School, and Whitney High.
Ownership History
Date
Name
Owned For
Owner Type
Purchase Details
Closed on
Mar 18, 2020
Sold by
Duncan James M and Walstrom Duncan Kristina
Bought by
Duncan James M and Walstrom Duncan Kristina
Current Estimated Value
Home Financials for this Owner
Home Financials are based on the most recent Mortgage that was taken out on this home.
Original Mortgage
$400,000
Outstanding Balance
$361,184
Interest Rate
3.4%
Mortgage Type
New Conventional
Estimated Equity
$390,033
Purchase Details
Closed on
Sep 27, 2001
Sold by
Mission Valley Syncon Lp
Bought by
Duncan James M and Duncan Kristina J
Purchase Details
Closed on
Jul 17, 2001
Sold by
Mission Valley Syncon Lp
Bought by
Duncan James M and Duncan Kristina J
Home Financials for this Owner
Home Financials are based on the most recent Mortgage that was taken out on this home.
Original Mortgage
$305,015
Interest Rate
7.21%
Mortgage Type
Stand Alone First
Create a Home Valuation Report for This Property
The Home Valuation Report is an in-depth analysis detailing your home's value as well as a comparison with similar homes in the area
Home Values in the Area
Average Home Value in this Area
Purchase History
| Date | Buyer | Sale Price | Title Company |
|---|---|---|---|
| Duncan James M | -- | First American Title Company | |
| Duncan James M | $305,909 | First American Title Ins Co |
Source: Public Records
Mortgage History
| Date | Status | Borrower | Loan Amount |
|---|---|---|---|
| Open | Duncan James M | $400,000 | |
| Closed | Duncan James M | $335,000 | |
| Closed | Duncan James M | $260,650 | |
| Closed | Duncan James M | $80,000 | |
| Closed | Duncan James M | $280,000 | |
| Closed | Duncan James M | $40,000 | |
| Previous Owner | Duncan James M | $305,015 | |
| Closed | Duncan James M | $45,752 |
Source: Public Records
Tax History Compared to Growth
Tax History
| Year | Tax Paid | Tax Assessment Tax Assessment Total Assessment is a certain percentage of the fair market value that is determined by local assessors to be the total taxable value of land and additions on the property. | Land | Improvement |
|---|---|---|---|---|
| 2023 | $5,857 | $447,001 | $106,484 | $340,517 |
| 2022 | $6,736 | $438,238 | $104,397 | $333,841 |
| 2021 | $6,666 | $429,646 | $102,350 | $327,296 |
| 2020 | $6,665 | $425,241 | $101,301 | $323,940 |
| 2019 | $9,271 | $416,904 | $99,315 | $317,589 |
| 2018 | $9,085 | $408,730 | $97,368 | $311,362 |
| 2017 | $9,020 | $400,716 | $95,459 | $305,257 |
| 2016 | $8,990 | $392,860 | $93,588 | $299,272 |
| 2015 | $8,890 | $386,960 | $92,183 | $294,777 |
| 2014 | $8,765 | $379,381 | $90,378 | $289,003 |
Source: Public Records
Map
Nearby Homes
- 6288 Lonetree Blvd
- 6222 Lonetree Blvd
- 6039 W Oaks Blvd
- 6608 Clapper Rail Ct
- 6019 W Oaks Blvd
- 6017 W Oaks Blvd
- 6015 W Oaks Blvd
- 1210 Sunset Blvd
- 6307 Lookout Pass Way
- 6457 Sonora Pass Way
- 6331 Surfbird Ln
- 8725 Cortina Cir
- 2120 Big Sky Dr
- 8432 Roseto Rd Unit 102
- 8136 Sienna Loop
- 8406 Oliva Rd Unit 152
- 9052 Cortina Cir Unit 219
- 2006 Silver Mountain Ct
- 7688 Rosehall Dr
- 6139 Frost Ridge Way