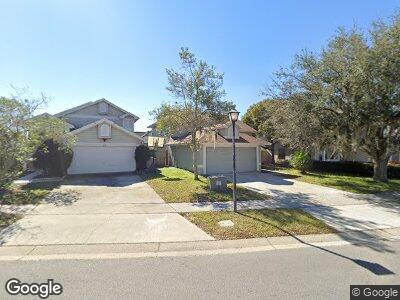
625 Cave Hollow Ln Orlando, FL 32828
Waterford Lakes South NeighborhoodEstimated Value: $394,603 - $421,000
4
Beds
3
Baths
1,577
Sq Ft
$258/Sq Ft
Est. Value
About This Home
This home is located at 625 Cave Hollow Ln, Orlando, FL 32828 and is currently estimated at $406,401, approximately $257 per square foot. 625 Cave Hollow Ln is a home located in Orange County with nearby schools including Waterford Elementary School, Discovery Middle School, and Timber Creek High School.
Ownership History
Date
Name
Owned For
Owner Type
Purchase Details
Closed on
Aug 29, 2019
Sold by
Goldman Jeffrey L and Goldman Dana
Bought by
Ih6 Property Florida Lp
Current Estimated Value
Purchase Details
Closed on
Dec 9, 1997
Sold by
Sec Of Va
Bought by
Goldman Jeffrey L and Goldman Dana
Home Financials for this Owner
Home Financials are based on the most recent Mortgage that was taken out on this home.
Original Mortgage
$97,050
Interest Rate
7.38%
Mortgage Type
VA
Purchase Details
Closed on
Aug 11, 1997
Sold by
Clerk Of The Court
Bought by
Sec Of Veterans Affairs
Purchase Details
Closed on
Jun 30, 1993
Sold by
Lennar Homes Inc
Bought by
Taboh Jeffrey David and Taboh Melinda A
Home Financials for this Owner
Home Financials are based on the most recent Mortgage that was taken out on this home.
Original Mortgage
$96,000
Interest Rate
7.52%
Mortgage Type
VA
Create a Home Valuation Report for This Property
The Home Valuation Report is an in-depth analysis detailing your home's value as well as a comparison with similar homes in the area
Home Values in the Area
Average Home Value in this Area
Purchase History
| Date | Buyer | Sale Price | Title Company |
|---|---|---|---|
| Ih6 Property Florida Lp | $240,000 | None Available | |
| Goldman Jeffrey L | $101,800 | -- | |
| Sec Of Veterans Affairs | $100 | -- | |
| Taboh Jeffrey David | $94,900 | -- |
Source: Public Records
Mortgage History
| Date | Status | Borrower | Loan Amount |
|---|---|---|---|
| Previous Owner | Goldman Jeffrey L | $86,000 | |
| Previous Owner | Sec Of Veterans Affairs | $97,050 | |
| Previous Owner | Taboh Jeffrey David | $96,000 |
Source: Public Records
Tax History Compared to Growth
Tax History
| Year | Tax Paid | Tax Assessment Tax Assessment Total Assessment is a certain percentage of the fair market value that is determined by local assessors to be the total taxable value of land and additions on the property. | Land | Improvement |
|---|---|---|---|---|
| 2024 | $4,758 | $319,380 | $70,000 | $249,380 |
| 2023 | $4,758 | $301,022 | $70,000 | $231,022 |
| 2022 | $4,239 | $258,366 | $65,000 | $193,366 |
| 2021 | $3,879 | $224,621 | $55,000 | $169,621 |
| 2020 | $3,401 | $199,659 | $45,000 | $154,659 |
| 2019 | $3,496 | $199,983 | $44,000 | $155,983 |
| 2018 | $3,246 | $182,530 | $44,000 | $138,530 |
| 2017 | $2,962 | $161,180 | $38,000 | $123,180 |
| 2016 | $2,777 | $149,514 | $30,000 | $119,514 |
| 2015 | $2,660 | $142,146 | $30,000 | $112,146 |
| 2014 | $2,643 | $144,968 | $40,000 | $104,968 |
Source: Public Records
Map
Nearby Homes
- 645 Upperriver Ct
- 12113 Calaboose Ct
- 12100 Calaboose Ct
- 991 Tillery Way Unit 103
- 12105 Harkness Ct
- 12121 Bruceton Way Unit 104
- 12107 Bruceton Way Unit 102
- 248 Pap Finn Ct
- 250 Silas Phelps Ct
- 102 Spanish Moss Ct
- 155 Aunt Polly Ct
- 12405 Marleigh Ct
- 12924 Lower River Blvd
- 12703 Whiterapids Dr
- 12613 Maribou Cir
- 713 Crest Pines Dr Unit 227
- 713 Crest Pines Dr Unit 236
- 725 Crest Pines Dr Unit 422
- 12712 Forestedge Cir
- 12826 Forestedge Cir