Estimated Value: $261,000 - $285,000
3
Beds
2
Baths
1,744
Sq Ft
$158/Sq Ft
Est. Value
About This Home
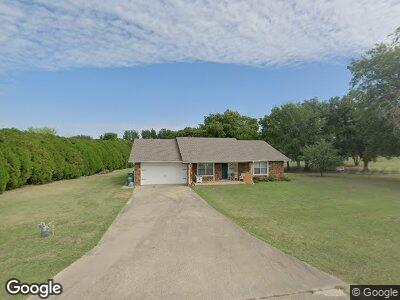
This home is located at 6251 E 165th St S, Bixby, OK 74008 and is currently estimated at $275,362, approximately $157 per square foot. 6251 E 165th St S is a home located in Tulsa County with nearby schools including Central Elementary School, Bixby Central Intermediate School, and Bixby Middle School.
Ownership History
Date
Name
Owned For
Owner Type
Purchase Details
Closed on
Feb 22, 2022
Sold by
Parker Joel S and Parker Sara
Bought by
Naz Adeel and Naz Bri Anna
Current Estimated Value
Home Financials for this Owner
Home Financials are based on the most recent Mortgage that was taken out on this home.
Original Mortgage
$230,252
Outstanding Balance
$216,228
Interest Rate
3.55%
Mortgage Type
FHA
Estimated Equity
$59,134
Purchase Details
Closed on
Feb 13, 2020
Sold by
Jlp Property Management Llc
Bought by
Parker Joel S
Home Financials for this Owner
Home Financials are based on the most recent Mortgage that was taken out on this home.
Original Mortgage
$123,500
Interest Rate
3.72%
Mortgage Type
New Conventional
Purchase Details
Closed on
Mar 19, 2010
Sold by
Rider Bob
Bought by
Parker Jeffrey T and Parker Laura A
Home Financials for this Owner
Home Financials are based on the most recent Mortgage that was taken out on this home.
Original Mortgage
$92,208
Interest Rate
4.95%
Mortgage Type
New Conventional
Create a Home Valuation Report for This Property
The Home Valuation Report is an in-depth analysis detailing your home's value as well as a comparison with similar homes in the area
Home Values in the Area
Average Home Value in this Area
Purchase History
| Date | Buyer | Sale Price | Title Company |
|---|---|---|---|
| Naz Adeel | $234,500 | Apex Title | |
| Naz Adeel | $234,500 | Apex Title | |
| Parker Joel S | $130,000 | American Abstract & Title Co | |
| Parker Jeffrey T | $115,500 | Firstitle & Abstract Service |
Source: Public Records
Mortgage History
| Date | Status | Borrower | Loan Amount |
|---|---|---|---|
| Open | Naz Adeel | $230,252 | |
| Closed | Naz Adeel | $230,252 | |
| Previous Owner | Parker Joel S | $123,500 | |
| Previous Owner | Parker Jeffrey T | $80,250 | |
| Previous Owner | Parker Jeffrey T | $92,208 |
Source: Public Records
Tax History Compared to Growth
Tax History
| Year | Tax Paid | Tax Assessment Tax Assessment Total Assessment is a certain percentage of the fair market value that is determined by local assessors to be the total taxable value of land and additions on the property. | Land | Improvement |
|---|---|---|---|---|
| 2024 | $3,609 | $27,089 | $3,114 | $23,975 |
| 2023 | $3,609 | $25,799 | $3,586 | $22,213 |
| 2022 | $2,068 | $14,716 | $3,593 | $11,123 |
| 2021 | $1,933 | $14,716 | $3,593 | $11,123 |
| 2020 | $1,908 | $14,437 | $3,525 | $10,912 |
| 2019 | $1,824 | $13,750 | $3,357 | $10,393 |
| 2018 | $1,807 | $13,750 | $3,357 | $10,393 |
| 2017 | $1,808 | $13,848 | $3,357 | $10,491 |
| 2016 | $1,787 | $13,848 | $3,357 | $10,491 |
| 2015 | $1,646 | $13,848 | $3,357 | $10,491 |
| 2014 | $1,565 | $12,705 | $3,080 | $9,625 |
Source: Public Records
Map
Nearby Homes
- 13915 S Joplin St S
- 5204 E 161st St S
- 7409 E 160th Place S
- 4712 E 177th Place S
- 4724 E 177th Place S
- 7408 E 159th St S
- 7500 E 159th Place S
- 17538 S 56th Ave E
- 17403 S 56th Ave E
- 17415 S 56th Ave E
- 17537 S 56th Ave E
- 15606 S 74th East Ave S
- 4903 E 174th St S
- 5536 E 174th St S
- 7500 E 157th Place S
- 5406 E 175th St S
- 5304 E 175th St S
- 5249 E 175th St S
- 15630 S 74th Ave E
- 7107 E 155th Place S