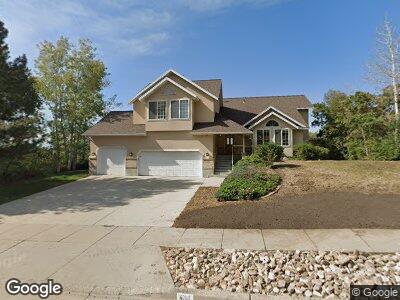
6282 S Heughs Canyon Dr Holladay, UT 84121
Outlying Salt Lake County NeighborhoodEstimated Value: $1,049,538 - $1,361,000
4
Beds
3
Baths
3,768
Sq Ft
$322/Sq Ft
Est. Value
About This Home
This home is located at 6282 S Heughs Canyon Dr, Holladay, UT 84121 and is currently estimated at $1,212,135, approximately $321 per square foot. 6282 S Heughs Canyon Dr is a home located in Salt Lake County with nearby schools including Oakwood Elementary School, Bonneville Junior High School, and Cottonwood High School.
Ownership History
Date
Name
Owned For
Owner Type
Purchase Details
Closed on
Nov 24, 2021
Sold by
Hoch James F and Anis Joyce
Bought by
Poulter Matthew
Current Estimated Value
Home Financials for this Owner
Home Financials are based on the most recent Mortgage that was taken out on this home.
Original Mortgage
$736,000
Outstanding Balance
$687,787
Interest Rate
3.09%
Mortgage Type
New Conventional
Estimated Equity
$414,702
Purchase Details
Closed on
Oct 5, 2010
Sold by
Hoch James F and Anis Joyce
Bought by
Hoch James F and Anis Joyce
Purchase Details
Closed on
Apr 28, 1998
Sold by
Lenamon Edward
Bought by
Hoch James F and Anis Joyce
Home Financials for this Owner
Home Financials are based on the most recent Mortgage that was taken out on this home.
Original Mortgage
$227,150
Interest Rate
7.06%
Mortgage Type
Purchase Money Mortgage
Purchase Details
Closed on
Aug 28, 1996
Sold by
Lenamon Mary Vernette
Bought by
Lenamon Edward
Create a Home Valuation Report for This Property
The Home Valuation Report is an in-depth analysis detailing your home's value as well as a comparison with similar homes in the area
Home Values in the Area
Average Home Value in this Area
Purchase History
| Date | Buyer | Sale Price | Title Company |
|---|---|---|---|
| Poulter Matthew | -- | Backman Title Services | |
| Hoch James F | -- | None Available | |
| Hoch James F | -- | -- | |
| Lenamon Edward | -- | -- |
Source: Public Records
Mortgage History
| Date | Status | Borrower | Loan Amount |
|---|---|---|---|
| Open | Poulter Matthew | $736,000 | |
| Previous Owner | Hoch James F | $227,150 |
Source: Public Records
Tax History Compared to Growth
Tax History
| Year | Tax Paid | Tax Assessment Tax Assessment Total Assessment is a certain percentage of the fair market value that is determined by local assessors to be the total taxable value of land and additions on the property. | Land | Improvement |
|---|---|---|---|---|
| 2023 | $5,156 | $822,190 | $440,290 | $381,900 |
| 2022 | $5,016 | $825,690 | $431,590 | $394,100 |
| 2021 | $4,365 | $635,400 | $258,700 | $376,700 |
| 2020 | $4,364 | $629,400 | $258,700 | $370,700 |
| 2019 | $4,212 | $590,190 | $250,790 | $339,400 |
| 2018 | $0 | $528,390 | $250,790 | $277,600 |
| 2017 | $3,768 | $518,390 | $250,790 | $267,600 |
| 2016 | $3,768 | $539,290 | $250,790 | $288,500 |
| 2015 | $248 | $541,890 | $233,490 | $308,400 |
| 2014 | $3,780 | $496,790 | $206,490 | $290,300 |
Source: Public Records
Map
Nearby Homes
- 6134 S Oak Canyon Dr
- 6623 S Hidden Mill Cove
- 6692 S Hidden Mill Cove
- 3185 Tolcate Hills Dr
- 6994 S Canyon Creek Cir
- 6658 S Caracol Cove
- 2938 Hollow Mill Dr
- 2633 E 6200 S Unit 7
- 2633 E 6200 S
- 3184 E Barnwood Bay
- 7048 S Horizon Cir
- 6991 Canyon Pines Cir
- 6930 Hollow Oaks Cir
- 2621 E Providence Ct
- 6736 S Benecia Dr
- 7063 S City View Dr
- 7063 S City View Dr Unit 14
- 7047 City View Dr
- 7047 City View Dr Unit 13
- 7077 S City View Dr