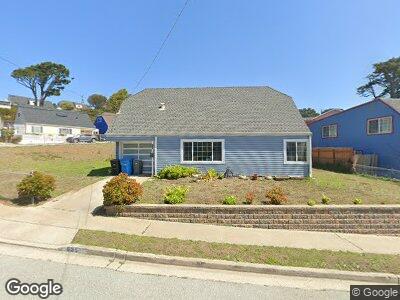
635 Lockhaven Dr Pacifica, CA 94044
Fairmont NeighborhoodEstimated Value: $1,068,000 - $1,271,399
3
Beds
2
Baths
1,440
Sq Ft
$829/Sq Ft
Est. Value
About This Home
This home is located at 635 Lockhaven Dr, Pacifica, CA 94044 and is currently estimated at $1,193,850, approximately $829 per square foot. 635 Lockhaven Dr is a home located in San Mateo County with nearby schools including Ocean Shore Elementary School, Cabrillo Elementary School, and Linda Mar Educational Center.
Ownership History
Date
Name
Owned For
Owner Type
Purchase Details
Closed on
Mar 18, 2014
Sold by
Everett Mark
Bought by
Everett Mark and Everett Evonne S
Current Estimated Value
Home Financials for this Owner
Home Financials are based on the most recent Mortgage that was taken out on this home.
Original Mortgage
$432,000
Interest Rate
4.18%
Mortgage Type
New Conventional
Purchase Details
Closed on
Nov 18, 2005
Sold by
Lee Henry and Redmond Rhonda Faye Draine
Bought by
Everett Mark
Home Financials for this Owner
Home Financials are based on the most recent Mortgage that was taken out on this home.
Original Mortgage
$484,000
Interest Rate
5.82%
Mortgage Type
Fannie Mae Freddie Mac
Purchase Details
Closed on
Sep 20, 1999
Sold by
Henry Lee and Draine Redmond Rhonda
Bought by
Lee Henry and Rhonda Faye Draine Redmond J
Create a Home Valuation Report for This Property
The Home Valuation Report is an in-depth analysis detailing your home's value as well as a comparison with similar homes in the area
Home Values in the Area
Average Home Value in this Area
Purchase History
| Date | Buyer | Sale Price | Title Company |
|---|---|---|---|
| Everett Mark | -- | First American Title Company | |
| Everett Mark | $605,000 | Old Republic Title Company | |
| Lee Henry | -- | -- |
Source: Public Records
Mortgage History
| Date | Status | Borrower | Loan Amount |
|---|---|---|---|
| Open | Everett Mark | $60,000 | |
| Open | Everett Mark | $383,500 | |
| Closed | Everett Mark | $389,500 | |
| Closed | Everett Mark | $432,000 | |
| Closed | Everett Mark | $480,000 | |
| Closed | Everett Mark | $100,000 | |
| Closed | Everett Mark | $484,000 | |
| Previous Owner | Lee Henry | $85,000 |
Source: Public Records
Tax History Compared to Growth
Tax History
| Year | Tax Paid | Tax Assessment Tax Assessment Total Assessment is a certain percentage of the fair market value that is determined by local assessors to be the total taxable value of land and additions on the property. | Land | Improvement |
|---|---|---|---|---|
| 2023 | $10,671 | $794,666 | $397,333 | $397,333 |
| 2022 | $9,752 | $779,086 | $389,543 | $389,543 |
| 2021 | $9,651 | $763,810 | $381,905 | $381,905 |
| 2020 | $9,808 | $755,980 | $377,990 | $377,990 |
| 2019 | $9,590 | $741,158 | $370,579 | $370,579 |
| 2018 | $9,196 | $726,626 | $363,313 | $363,313 |
| 2017 | $8,909 | $712,380 | $356,190 | $356,190 |
| 2016 | $8,705 | $698,412 | $349,206 | $349,206 |
| 2015 | $8,411 | $687,922 | $343,961 | $343,961 |
| 2014 | $7,515 | $605,000 | $302,500 | $302,500 |
Source: Public Records
Map
Nearby Homes
- 664 Claridge Dr
- 498 Manor Dr
- 2751 Duhallow Way
- 3865 Carter Dr Unit 202
- 3740 Callan Blvd
- 3550 Carter Dr Unit 117
- 0 Manor Dr Unit 424028789
- 375 Shipley Ave
- 312 Warwick St
- 3906 Stein Ct
- 443 Monterey Rd
- 815 Edgemar Ave
- 401 Monterey Rd
- 214 Warwick St
- 483 Andover Dr
- 2504 Ardee Ln
- 278 Beachview Ave Unit 21
- 370 Monterey Rd
- 443 Andover Dr
- 3901 Coronado Way