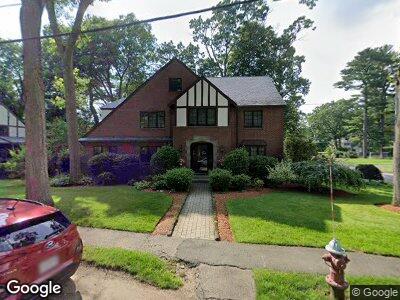
64 Windsor Rd Milton, MA 02186
Columbine Cliffs NeighborhoodEstimated Value: $1,372,000 - $1,817,000
4
Beds
4
Baths
3,363
Sq Ft
$476/Sq Ft
Est. Value
About This Home
This home is located at 64 Windsor Rd, Milton, MA 02186 and is currently estimated at $1,600,788, approximately $476 per square foot. 64 Windsor Rd is a home located in Norfolk County with nearby schools including Milton High School, St. Mary of the Hills School, and Saint John Paul II Catholic Academy.
Ownership History
Date
Name
Owned For
Owner Type
Purchase Details
Closed on
Jan 19, 2022
Sold by
Feltmate Colleen M and Pellitta Frank
Bought by
C M Feltmate 2022 Ret
Current Estimated Value
Purchase Details
Closed on
Jan 4, 2021
Sold by
Feltmate Colleen M
Bought by
Feltmate Colleen M and Pellitta Frank
Home Financials for this Owner
Home Financials are based on the most recent Mortgage that was taken out on this home.
Original Mortgage
$690,000
Interest Rate
2.71%
Mortgage Type
Stand Alone Refi Refinance Of Original Loan
Purchase Details
Closed on
Aug 31, 1995
Sold by
Daley David F and Daley Mary J
Bought by
Lipson Wayne E
Create a Home Valuation Report for This Property
The Home Valuation Report is an in-depth analysis detailing your home's value as well as a comparison with similar homes in the area
Home Values in the Area
Average Home Value in this Area
Purchase History
| Date | Buyer | Sale Price | Title Company |
|---|---|---|---|
| C M Feltmate 2022 Ret | -- | None Available | |
| Feltmate Colleen M | -- | None Available | |
| Lipson Wayne E | $316,000 | -- |
Source: Public Records
Mortgage History
| Date | Status | Borrower | Loan Amount |
|---|---|---|---|
| Previous Owner | Feltmate Colleen M | $690,000 | |
| Previous Owner | Feltmate Colleen M | $382,444 | |
| Previous Owner | Daley David F | $417,000 | |
| Previous Owner | Daley David F | $417,000 | |
| Previous Owner | Feltmate Colleen M | $48,000 | |
| Previous Owner | Feltmate Colleen M | $560,000 | |
| Previous Owner | Feltmate Colleen M | $450,000 | |
| Previous Owner | Daley David F | $52,000 |
Source: Public Records
Tax History Compared to Growth
Tax History
| Year | Tax Paid | Tax Assessment Tax Assessment Total Assessment is a certain percentage of the fair market value that is determined by local assessors to be the total taxable value of land and additions on the property. | Land | Improvement |
|---|---|---|---|---|
| 2025 | $16,367 | $1,475,800 | $568,500 | $907,300 |
| 2024 | $15,821 | $1,448,800 | $541,500 | $907,300 |
| 2023 | $15,354 | $1,346,800 | $515,700 | $831,100 |
| 2022 | $14,491 | $1,162,100 | $515,700 | $646,400 |
| 2021 | $14,083 | $1,072,600 | $457,000 | $615,600 |
| 2020 | $13,860 | $1,056,400 | $452,600 | $603,800 |
| 2019 | $13,517 | $1,025,600 | $439,400 | $586,200 |
| 2018 | $12,900 | $934,100 | $358,100 | $576,000 |
| 2017 | $12,068 | $890,000 | $341,100 | $548,900 |
| 2016 | $11,281 | $835,600 | $298,400 | $537,200 |
| 2015 | $10,518 | $754,500 | $255,800 | $498,700 |
Source: Public Records
Map
Nearby Homes
- 210-212 Brook Rd
- 2 Viola St Unit 2A
- Lot C Central Ave
- 143 Thacher St
- 5 Lincoln St
- 33 Capen St
- 55 Thompson Ln
- 6 Briarfield Rd
- 60 Houston Ave Unit 2
- 128 Blue Hills Pkwy
- 23 Willoughby Rd
- 18 Dyer Ave
- 24 Houston Ave Unit 1
- 197 Blue Hills Pkwy
- 45 Frothingham St
- 107 Central Ave
- 0 Blue Hill Ave
- 111 Elm St
- 23 Union Ave
- 70 Brush Hill Rd Unit 70