642 Catalina Cir Unit 9 Vallejo, CA 94589
North Vallejo NeighborhoodEstimated Value: $602,000 - $676,000
3
Beds
3
Baths
1,741
Sq Ft
$365/Sq Ft
Est. Value
About This Home
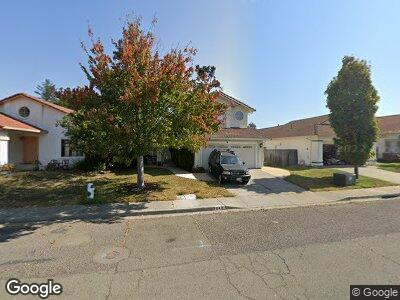
This home is located at 642 Catalina Cir Unit 9, Vallejo, CA 94589 and is currently estimated at $635,517, approximately $365 per square foot. 642 Catalina Cir Unit 9 is a home located in Solano County with nearby schools including Dan Mini Elementary School, Solano Middle School, and Vallejo High School.
Ownership History
Date
Name
Owned For
Owner Type
Purchase Details
Closed on
Oct 8, 2019
Sold by
Lang Gordon E and Lang Belinda B
Bought by
Levey Christine
Current Estimated Value
Home Financials for this Owner
Home Financials are based on the most recent Mortgage that was taken out on this home.
Original Mortgage
$396,000
Interest Rate
3.5%
Mortgage Type
New Conventional
Purchase Details
Closed on
Oct 22, 2004
Sold by
Losch Rudolf and Losch Doris E
Bought by
Lang Gordon E and Lang Belinda B
Home Financials for this Owner
Home Financials are based on the most recent Mortgage that was taken out on this home.
Original Mortgage
$356,000
Interest Rate
1%
Mortgage Type
Negative Amortization
Create a Home Valuation Report for This Property
The Home Valuation Report is an in-depth analysis detailing your home's value as well as a comparison with similar homes in the area
Home Values in the Area
Average Home Value in this Area
Purchase History
| Date | Buyer | Sale Price | Title Company |
|---|---|---|---|
| Levey Christine | $495,000 | Placer Title Company | |
| Lang Gordon E | $445,000 | North American Title Co |
Source: Public Records
Mortgage History
| Date | Status | Borrower | Loan Amount |
|---|---|---|---|
| Open | Levey Christine | $396,000 | |
| Previous Owner | Levey Christine | $396,000 | |
| Previous Owner | Lang Gordon E | $170,458 | |
| Previous Owner | Lang Gordon E | $100,000 | |
| Previous Owner | Lang Gordon E | $200,000 | |
| Previous Owner | Lang Gordon E | $356,000 |
Source: Public Records
Tax History Compared to Growth
Tax History
| Year | Tax Paid | Tax Assessment Tax Assessment Total Assessment is a certain percentage of the fair market value that is determined by local assessors to be the total taxable value of land and additions on the property. | Land | Improvement |
|---|---|---|---|---|
| 2024 | $8,240 | $530,737 | $160,829 | $369,908 |
| 2023 | $7,884 | $520,331 | $157,676 | $362,655 |
| 2022 | $7,810 | $510,130 | $154,585 | $355,545 |
| 2021 | $7,664 | $500,128 | $151,554 | $348,574 |
| 2020 | $6,766 | $495,000 | $150,000 | $345,000 |
| 2019 | $6,096 | $450,000 | $54,000 | $396,000 |
| 2018 | $5,704 | $439,000 | $57,000 | $382,000 |
| 2017 | $4,670 | $358,000 | $50,000 | $308,000 |
| 2016 | $3,613 | $308,000 | $46,000 | $262,000 |
| 2015 | $3,402 | $289,000 | $46,000 | $243,000 |
| 2014 | $2,538 | $212,000 | $34,000 | $178,000 |
Source: Public Records
Map
Nearby Homes
- 141 Albatrosse Way
- 125 Albatrosse Way
- 239 Catalina Way
- 190 Yukon Ct
- 129 Carnation Cir
- 1846 Mini Dr
- 379 Meadows Dr
- 429 Knightsbridge Way
- 140 Boggs Ct
- 105 Obrien Cir
- 417 Poppyfield Dr
- 11 Peacock Cir
- 1326 Elliott Dr
- 330 Brookshire Ct
- 272 Hummingbird Way
- 240 Rinaldo Dr
- 706 Capra Dr
- 121 Forsythia Ct
- 53 Bidwell Way
- 150 Daisy Ct