$781,000 - $890,000
RENTED MAY 24, 2024

65 Livingston Ave Unit 3 Lyndhurst, NJ 07071

Lyndhurst Neighborhood
1 Bed
1 Bath
2,041 Sq Ft
$404 Price per Sq Ft

About This Home

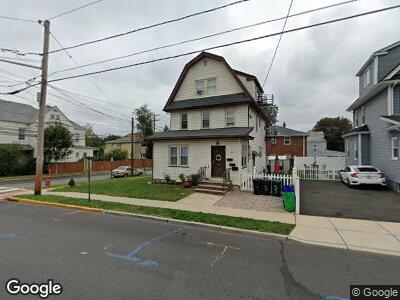
Commuters Delight! Updated and Bright 3nd flr apartment in 3-Family owner occupied house. Plenty of closets. Blocks to train station Shop Rite, shopping center and center of town, plus New York express bus. Easy street parking on quiet street. Close to highways & shopping. One small pet may be considered. No cat due to allergy. No smoking. Credit check, rental application and interview required. Pictures taken before current tenant moved in.

Ownership History

Date Name Owned For Owner Type

Purchase Details

Closed on
Jul 9, 2021
Sold by
Wang Zhong Gui and Feng Lin
Bought by
Ovadia Edward and Hsu Jui Chen
Current Estimated Value
$825,301

Home Financials for this Owner

Home Financials are based on the most recent Mortgage that was taken out on this home.
Original Mortgage
$620,675
Outstanding Balance
$570,012
Interest Rate
3%
Mortgage Type
FHA
Estimated Equity
$255,289

Purchase Details

Closed on
Aug 25, 2010
Sold by
Landells Deborah
Bought by
Wang Zhong Gui

Home Financials for this Owner

Home Financials are based on the most recent Mortgage that was taken out on this home.
Original Mortgage
$245,000
Interest Rate
4.04%
Mortgage Type
Purchase Money Mortgage

Purchase Details

Closed on
Sep 7, 1999
Sold by
Landells Deborah and Estate Of Claire M Landells
Bought by
Landells Deborah

Home Financials for this Owner

Home Financials are based on the most recent Mortgage that was taken out on this home.
Original Mortgage
$85,000
Interest Rate
7.78%
Mortgage Type
Stand Alone Second

Range of Values:

Collateral Analytics

Collateral Analytics Collateral Analytics AVMs (Automated Valuation Model) employ a number of statistical approaches combined with neighborhood-specific comparable selection guarantees the most up-to-date and precise valuations.

Not Available

Collateral Analytics does not have data for the current month. Please view the chart for historical values.

ICE

ICE Mortgage Technology ICE Mortgage Technology’s AVM (Automated Valuation Model) is a state-of-the-art online residential property valuation tool that provides a quick and accurate estimate of the value of almost any home in the U.S.

Not Available

ICE Mortgage Technology does not have data for the current month. Please view the chart for historical values.

First American

First American First American Data & Analytics’ next-generation AVM combines unrivaled data assets with a blended ensemble of valuation models to produce highly accurate, reliable valuations you can trust.

Not Available

First American does not have data for the current month. Please view the chart for historical values.

Quantarium

Quantarium Quantarium’s valuation service, repeatedly proven the industry’s most accurate and comprehensive, is supercharged with a self-learning and auto-tuning AI engine that continually becomes smarter and more accurate as it processes daily inputs from the industry’s leading RE data lake.

Not Available

Quantarium does not have data for the current month. Please view the chart for historical values.

Average Value
Not Available
List Price
Sold Price
Create a Home Valuation Report for This Property
The Home Valuation Report is an in-depth analysis detailing your home's value as well as a comparison with similar homes in the area

Home Values in the Area

Source: Public Records

Average Home Value in this Area


Source: Public Records

Purchase History

Date Buyer Sale Price Title Company
Ovadia Edward $685,000 Fidelity National Ttl Ins Co
Wang Zhong Gui $350,000 --
Landells Deborah -- --
Source: Public Records

Mortgage History

Date Status Borrower Loan Amount
Open Ovadia Edward $620,675
Previous Owner Hw Zhong Gui Wang $276,700
Previous Owner Wang Zhong Gui $245,000
Previous Owner Landells Deborah S $151,742
Previous Owner Landells Deborah $135,000
Previous Owner Landells Deborah $85,000
Source: Public Records

Property History

Date Event Price Change Sq Ft Price
05/24/2024 05/24/24 Rented $1,600 0.0% --
05/18/2024 05/18/24 Price Changed $1,600 -4.8% --
04/20/2024 04/20/24 For Rent $1,680 +8.4% --
10/29/2022 10/29/22 Rented $1,550 0.0% --
10/13/2022 10/13/22 For Rent $1,550 -- --

Tax History Compared to Growth

Source: Public Records

Tax History

Year Tax Paid Tax Assessment Tax Assessment Total Assessment is a certain percentage of the fair market value that is determined by local assessors to be the total taxable value of land and additions on the property. Land Improvement
2024 $10,969 $553,500 $221,400 $332,100
2023 $9,684 $539,800 $211,400 $328,400
2022 $9,684 $305,300 $151,500 $153,800
2021 $9,281 $305,300 $151,500 $153,800
2020 $9,080 $305,300 $151,500 $153,800
2019 $9,012 $305,300 $151,500 $153,800
2018 $9,086 $305,300 $151,500 $153,800
2017 $8,538 $294,300 $151,500 $142,800
2016 $8,346 $294,300 $151,500 $142,800
2015 $8,084 $294,300 $151,500 $142,800
2014 $7,978 $294,300 $151,500 $142,800
Source: Public Records

Agents Affiliated with this Home

  • Section Image
See All Agents

Map