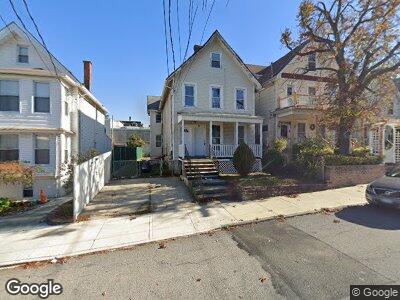
65 Union Ave Staten Island, NY 10303
Mariners Harbor NeighborhoodEstimated Value: $574,511 - $738,000
5
Beds
2
Baths
2,785
Sq Ft
$232/Sq Ft
Est. Value
About This Home
This home is located at 65 Union Ave, Staten Island, NY 10303 and is currently estimated at $646,378, approximately $232 per square foot. 65 Union Ave is a home located in Richmond County with nearby schools including P.S. 44 Thomas C Brown, I.S. 51 Edwin Markham, and Port Richmond High School.
Ownership History
Date
Name
Owned For
Owner Type
Purchase Details
Closed on
Feb 14, 2003
Sold by
Homebuyers Warehouse
Bought by
Fortoso Pedro and Velez Argimilo
Current Estimated Value
Home Financials for this Owner
Home Financials are based on the most recent Mortgage that was taken out on this home.
Original Mortgage
$315,250
Interest Rate
5.93%
Mortgage Type
FHA
Purchase Details
Closed on
Aug 22, 2002
Sold by
Coleman Jayne E and Livingston Phyllis E
Bought by
Homebuyers Warehouse Ltd
Create a Home Valuation Report for This Property
The Home Valuation Report is an in-depth analysis detailing your home's value as well as a comparison with similar homes in the area
Home Values in the Area
Average Home Value in this Area
Purchase History
| Date | Buyer | Sale Price | Title Company |
|---|---|---|---|
| Fortoso Pedro | $325,000 | Old Republic Natl Title Ins | |
| Homebuyers Warehouse Ltd | $190,000 | -- |
Source: Public Records
Mortgage History
| Date | Status | Borrower | Loan Amount |
|---|---|---|---|
| Previous Owner | Fortoso Pedro | $315,250 |
Source: Public Records
Tax History Compared to Growth
Tax History
| Year | Tax Paid | Tax Assessment Tax Assessment Total Assessment is a certain percentage of the fair market value that is determined by local assessors to be the total taxable value of land and additions on the property. | Land | Improvement |
|---|---|---|---|---|
| 2024 | $5,044 | $31,200 | $6,181 | $25,019 |
| 2023 | $4,812 | $23,692 | $5,004 | $18,688 |
| 2022 | $4,462 | $31,320 | $7,680 | $23,640 |
| 2021 | $4,509 | $27,780 | $7,680 | $20,100 |
| 2020 | $5,300 | $23,940 | $7,680 | $16,260 |
| 2019 | $5,121 | $24,720 | $7,680 | $17,040 |
| 2018 | $4,025 | $19,743 | $6,414 | $13,329 |
| 2017 | $3,797 | $18,627 | $7,569 | $11,058 |
| 2016 | $3,569 | $17,853 | $6,967 | $10,886 |
| 2015 | $3,347 | $17,838 | $5,376 | $12,462 |
| 2014 | $3,347 | $17,439 | $5,777 | $11,662 |
Source: Public Records
Map
Nearby Homes