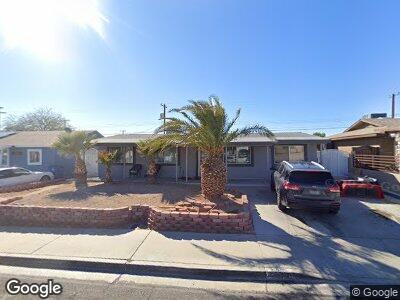
6513 Bourbon Way Las Vegas, NV 89107
Charleston Preservation NeighborhoodEstimated Value: $250,000 - $321,000
3
Beds
1
Bath
1,219
Sq Ft
$235/Sq Ft
Est. Value
About This Home
This home is located at 6513 Bourbon Way, Las Vegas, NV 89107 and is currently estimated at $286,479, approximately $235 per square foot. 6513 Bourbon Way is a home located in Clark County with nearby schools including Rose Warren Elementary School, Frank F Garside Junior High School, and Bonanza High School.
Ownership History
Date
Name
Owned For
Owner Type
Purchase Details
Closed on
Jun 27, 2024
Sold by
Rodriguez Jimmy Ivan
Bought by
Figueroa Mara
Current Estimated Value
Home Financials for this Owner
Home Financials are based on the most recent Mortgage that was taken out on this home.
Original Mortgage
$100,000
Outstanding Balance
$99,237
Interest Rate
6.95%
Mortgage Type
New Conventional
Estimated Equity
$184,484
Purchase Details
Closed on
Mar 25, 2023
Sold by
Figueroa Mara
Bought by
Meza Froikan Meza and Montoy-Meza Maricarmen
Purchase Details
Closed on
Sep 15, 2010
Sold by
Doxey David E
Bought by
Figueroa Mara
Purchase Details
Closed on
Jul 29, 1999
Sold by
Zawadzki Thomas J and Zawadzki Kristine L
Bought by
Figueroa Juan
Home Financials for this Owner
Home Financials are based on the most recent Mortgage that was taken out on this home.
Original Mortgage
$66,320
Interest Rate
10.85%
Create a Home Valuation Report for This Property
The Home Valuation Report is an in-depth analysis detailing your home's value as well as a comparison with similar homes in the area
Home Values in the Area
Average Home Value in this Area
Purchase History
| Date | Buyer | Sale Price | Title Company |
|---|---|---|---|
| Figueroa Mara | -- | Chicago Title | |
| Meza Froikan Meza | $126,851 | None Listed On Document | |
| Figueroa Mara | $109,000 | None Available | |
| Figueroa Juan | $83,000 | United Title |
Source: Public Records
Mortgage History
| Date | Status | Borrower | Loan Amount |
|---|---|---|---|
| Open | Figueroa Mara | $100,000 | |
| Previous Owner | Figueroa Juan | $100,000 | |
| Previous Owner | Figueroa Juan | $66,320 | |
| Closed | Figueroa Juan | $66,320 |
Source: Public Records
Tax History Compared to Growth
Tax History
| Year | Tax Paid | Tax Assessment Tax Assessment Total Assessment is a certain percentage of the fair market value that is determined by local assessors to be the total taxable value of land and additions on the property. | Land | Improvement |
|---|---|---|---|---|
| 2025 | $828 | $46,321 | $30,800 | $15,521 |
| 2024 | $767 | $46,321 | $30,800 | $15,521 |
| 2023 | $767 | $44,398 | $30,450 | $13,948 |
| 2022 | $711 | $37,708 | $25,200 | $12,508 |
| 2021 | $658 | $35,054 | $23,450 | $11,604 |
| 2020 | $608 | $30,895 | $19,600 | $11,295 |
| 2019 | $570 | $28,401 | $17,500 | $10,901 |
| 2018 | $544 | $24,899 | $14,700 | $10,199 |
| 2017 | $790 | $24,107 | $14,000 | $10,107 |
| 2016 | $511 | $19,907 | $10,150 | $9,757 |
| 2015 | $508 | $17,164 | $7,700 | $9,464 |
| 2014 | $701 | $14,571 | $5,250 | $9,321 |
Source: Public Records
Map
Nearby Homes
- 6508 Bourbon Way
- 709 Scholl Dr
- 6520 Evergreen Ave
- 6529 Bannock Way Unit 27C
- 6428 Evergreen Ave
- 6425 Evergreen Ave
- 6545 Casada Way
- 6624 Brandywine Way
- 6729 Wenatchee Dr
- 325 Greenfield Ln
- 6232 Bristol Way
- 321 Bent Creek Dr
- 6749 W Charleston Blvd Unit 3
- 6749 W Charleston Blvd Unit 2
- 6743 W Charleston Blvd Unit 4
- 6735 W Charleston Blvd Unit 4
- 304 S Crestline Dr
- 6213 Burgundy Way
- 6232 Blair Way
- 6212 Burgundy Way