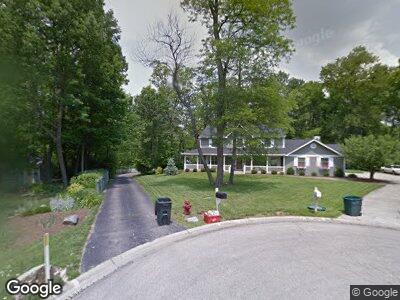
6533 Covey Ct Loveland, OH 45140
Outer Loveland NeighborhoodEstimated Value: $366,000 - $444,000
3
Beds
3
Baths
1,919
Sq Ft
$212/Sq Ft
Est. Value
About This Home
This home is located at 6533 Covey Ct, Loveland, OH 45140 and is currently estimated at $406,461, approximately $211 per square foot. 6533 Covey Ct is a home located in Clermont County with nearby schools including Loveland Intermediate School, Loveland Primary School, and Loveland Elementary School.
Ownership History
Date
Name
Owned For
Owner Type
Purchase Details
Closed on
Mar 24, 2023
Sold by
Kiraly Florence
Bought by
Tobergta James and Kessel Nicole
Current Estimated Value
Home Financials for this Owner
Home Financials are based on the most recent Mortgage that was taken out on this home.
Original Mortgage
$304,800
Outstanding Balance
$297,250
Interest Rate
6.12%
Mortgage Type
New Conventional
Estimated Equity
$109,211
Purchase Details
Closed on
Sep 18, 2015
Sold by
Kiraly Marc
Bought by
Kiraly Florence
Purchase Details
Closed on
Mar 2, 2005
Sold by
Kay Howard G
Bought by
Kiraly Marc and Kiraly Florence
Home Financials for this Owner
Home Financials are based on the most recent Mortgage that was taken out on this home.
Original Mortgage
$187,760
Interest Rate
5.67%
Mortgage Type
Purchase Money Mortgage
Purchase Details
Closed on
Feb 10, 1992
Purchase Details
Closed on
Oct 1, 1988
Purchase Details
Closed on
Jul 1, 1986
Purchase Details
Closed on
Aug 1, 1985
Create a Home Valuation Report for This Property
The Home Valuation Report is an in-depth analysis detailing your home's value as well as a comparison with similar homes in the area
Home Values in the Area
Average Home Value in this Area
Purchase History
| Date | Buyer | Sale Price | Title Company |
|---|---|---|---|
| Tobergta James | $381,000 | -- | |
| Kiraly Florence | $125 | None Available | |
| Kiraly Marc | $234,700 | First Title Agency Inc | |
| -- | $31,500 | -- | |
| -- | $25,500 | -- | |
| -- | $23,000 | -- | |
| -- | $21,500 | -- |
Source: Public Records
Mortgage History
| Date | Status | Borrower | Loan Amount |
|---|---|---|---|
| Open | Tobergta James | $304,800 | |
| Previous Owner | Kiraly Florence | $153,900 | |
| Previous Owner | Kiraly Marc | $25,000 | |
| Previous Owner | Kiraly Marc | $187,760 |
Source: Public Records
Tax History Compared to Growth
Tax History
| Year | Tax Paid | Tax Assessment Tax Assessment Total Assessment is a certain percentage of the fair market value that is determined by local assessors to be the total taxable value of land and additions on the property. | Land | Improvement |
|---|---|---|---|---|
| 2024 | $5,733 | $114,870 | $30,450 | $84,420 |
| 2023 | $5,838 | $114,870 | $30,450 | $84,420 |
| 2022 | $4,080 | $67,340 | $17,850 | $49,490 |
| 2021 | $4,087 | $67,340 | $17,850 | $49,490 |
| 2020 | $4,099 | $67,340 | $17,850 | $49,490 |
| 2019 | $4,353 | $67,630 | $17,820 | $49,810 |
| 2018 | $4,377 | $67,630 | $17,820 | $49,810 |
| 2017 | $4,137 | $67,630 | $17,820 | $49,810 |
| 2016 | $4,137 | $59,820 | $15,750 | $44,070 |
| 2015 | $4,033 | $59,820 | $15,750 | $44,070 |
| 2014 | $3,971 | $59,820 | $15,750 | $44,070 |
| 2013 | $4,541 | $72,310 | $15,750 | $56,560 |
Source: Public Records
Map
Nearby Homes
- 6562 Branch Hill Guinea Pike
- 6521 Branch Hill Guinea Pike
- 571 Miami Bluff Ct
- 579 Miami Bluff Ct
- 902 Forestview Ct
- 6547 Conner Ln
- 6551 Hollow Ln
- 6416 Birch Creek Dr
- 810 Wards Corner Rd
- 818 Wards Corner Rd
- 6391 Birch Creek Dr
- 770 Cedar Dr
- 6670 Loveland Miamiville Rd
- 1255 Ridgewood Dr
- 338 Wiltsee Ave
- 6786 Little River Ln
- 6624 Saddlebrook Ct
- 6148 Court Side Place
- 6249 Davon Ct
- 949 Paul Vista Dr