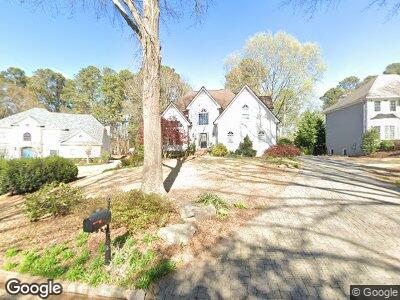
655 655 Boxwood Terrace Alpharetta, GA 30005
Seven Oaks NeighborhoodEstimated Value: $923,737 - $950,000
4
Beds
5
Baths
3,148
Sq Ft
$298/Sq Ft
Est. Value
About This Home
This home is located at 655 655 Boxwood Terrace, Alpharetta, GA 30005 and is currently estimated at $939,434, approximately $298 per square foot. 655 655 Boxwood Terrace is a home located in Fulton County with nearby schools including River Trail Middle School, Northview High School, and McGinnis Woods School.
Ownership History
Date
Name
Owned For
Owner Type
Purchase Details
Closed on
Jun 30, 2017
Sold by
Redmond Donald P
Bought by
Jensen Cameron and Jensen Alicia
Current Estimated Value
Home Financials for this Owner
Home Financials are based on the most recent Mortgage that was taken out on this home.
Original Mortgage
$476,000
Interest Rate
3.94%
Mortgage Type
New Conventional
Purchase Details
Closed on
Aug 5, 1996
Sold by
Waage Robert N Marlene J
Bought by
Redmond Donald P Cherryl
Purchase Details
Closed on
Mar 11, 1993
Sold by
Cephus William Judy
Bought by
Waage Robert N Marlene J
Home Financials for this Owner
Home Financials are based on the most recent Mortgage that was taken out on this home.
Original Mortgage
$185,000
Interest Rate
4.3%
Create a Home Valuation Report for This Property
The Home Valuation Report is an in-depth analysis detailing your home's value as well as a comparison with similar homes in the area
Home Values in the Area
Average Home Value in this Area
Purchase History
| Date | Buyer | Sale Price | Title Company |
|---|---|---|---|
| Jensen Cameron | $560,000 | -- | |
| Redmond Donald P Cherryl | $260,800 | -- | |
| Waage Robert N Marlene J | $237,300 | -- |
Source: Public Records
Mortgage History
| Date | Status | Borrower | Loan Amount |
|---|---|---|---|
| Open | Jensen Cameron | $425,000 | |
| Closed | Jensen Cameron | $476,000 | |
| Previous Owner | Redmond Donald P | $228,000 | |
| Previous Owner | Redmond Donald P | $270,000 | |
| Previous Owner | Redmond Donald P | $45,000 | |
| Previous Owner | Redmond Donald P | $217,500 | |
| Previous Owner | Waage Robert N Marlene J | $185,000 | |
| Closed | Redmond Donald P Cherryl | $0 |
Source: Public Records
Tax History Compared to Growth
Tax History
| Year | Tax Paid | Tax Assessment Tax Assessment Total Assessment is a certain percentage of the fair market value that is determined by local assessors to be the total taxable value of land and additions on the property. | Land | Improvement |
|---|---|---|---|---|
| 2023 | $8,633 | $305,840 | $76,600 | $229,240 |
| 2022 | $5,274 | $248,680 | $60,160 | $188,520 |
| 2021 | $5,219 | $205,520 | $55,320 | $150,200 |
| 2020 | $5,263 | $210,680 | $59,160 | $151,520 |
| 2019 | $641 | $206,960 | $58,120 | $148,840 |
| 2018 | $5,597 | $192,480 | $71,240 | $121,240 |
| 2017 | $5,218 | $165,720 | $59,680 | $106,040 |
| 2016 | $5,112 | $165,720 | $59,680 | $106,040 |
| 2015 | $5,166 | $165,720 | $59,680 | $106,040 |
| 2014 | $4,695 | $146,160 | $52,640 | $93,520 |
Source: Public Records
Map
Nearby Homes
- 12340 Preserve Ln
- 12370 Preserve Ln
- 5620 Preserve Cir
- 5405 Preserve Cir
- 935 Magnolia Blossom Ct
- 205 Ashebourne Trail
- 5485 Woodrun Ln Unit 1
- 940 Magnolia Blossom Ct Unit 4D
- 3535 Southmont Ct
- 400 Overhill Bend
- 7350 Brassfield Dr
- 110 Compton Hall Dr
- 7335 Treyland Ct
- 7545 Brookwood Way Unit IIB
- 12495 Concord Hall Dr
- 280 Leaf Ct
- 3840 Montvale Crossing
- 12270 Leeward Walk Cir
- 245 Davenham Ct