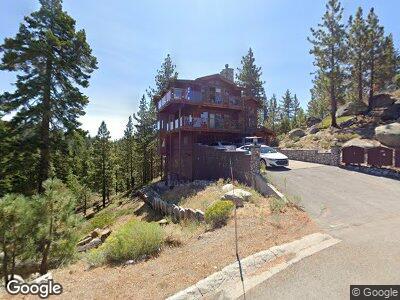
655 Tina Ct Stateline, NV 89449
Kingsbury NeighborhoodEstimated Value: $2,469,000 - $3,301,000
--
Bed
--
Bath
4,151
Sq Ft
$680/Sq Ft
Est. Value
About This Home
This home is located at 655 Tina Ct, Stateline, NV 89449 and is currently estimated at $2,821,604, approximately $679 per square foot. 655 Tina Ct is a home with nearby schools including Zephyr Cove Elementary School, George Whittell High School, and Douglas County High School.
Ownership History
Date
Name
Owned For
Owner Type
Purchase Details
Closed on
Oct 5, 2018
Sold by
Williams Monte
Bought by
Cozy Vacation Rentals Llc
Current Estimated Value
Purchase Details
Closed on
May 30, 2018
Sold by
Cozy Vacation Rentals Llc
Bought by
Williams Monte and Monte Williams Revocable Trust
Home Financials for this Owner
Home Financials are based on the most recent Mortgage that was taken out on this home.
Original Mortgage
$451,800
Interest Rate
4.5%
Mortgage Type
New Conventional
Purchase Details
Closed on
May 18, 2018
Sold by
Wu Jeanne
Bought by
Williams Monte
Home Financials for this Owner
Home Financials are based on the most recent Mortgage that was taken out on this home.
Original Mortgage
$451,800
Interest Rate
4.5%
Mortgage Type
New Conventional
Purchase Details
Closed on
Jan 3, 2012
Sold by
Williams Monte
Bought by
Cozy Vacation Rentals Llc
Create a Home Valuation Report for This Property
The Home Valuation Report is an in-depth analysis detailing your home's value as well as a comparison with similar homes in the area
Home Values in the Area
Average Home Value in this Area
Purchase History
| Date | Buyer | Sale Price | Title Company |
|---|---|---|---|
| Cozy Vacation Rentals Llc | -- | None Available | |
| Williams Monte | -- | First Centennial Reno | |
| Williams Monte | -- | First Centennial Reno | |
| Cozy Vacation Rentals Llc | -- | None Available |
Source: Public Records
Mortgage History
| Date | Status | Borrower | Loan Amount |
|---|---|---|---|
| Previous Owner | Williams Monte | $451,800 |
Source: Public Records
Tax History Compared to Growth
Tax History
| Year | Tax Paid | Tax Assessment Tax Assessment Total Assessment is a certain percentage of the fair market value that is determined by local assessors to be the total taxable value of land and additions on the property. | Land | Improvement |
|---|---|---|---|---|
| 2025 | $15,396 | $471,152 | $241,500 | $229,652 |
| 2024 | $15,396 | $474,363 | $241,500 | $232,863 |
| 2023 | $14,288 | $460,786 | $241,500 | $219,286 |
| 2022 | $13,211 | $426,659 | $220,500 | $206,159 |
| 2021 | $12,234 | $398,595 | $201,250 | $197,345 |
| 2020 | $11,835 | $395,916 | $201,250 | $194,666 |
| 2019 | $11,420 | $375,023 | $182,875 | $192,148 |
| 2018 | $10,895 | $353,966 | $166,250 | $187,716 |
| 2017 | $10,465 | $355,289 | $166,250 | $189,039 |
| 2016 | $10,201 | $314,773 | $122,500 | $192,273 |
| 2015 | $10,163 | $314,773 | $122,500 | $192,273 |
| 2014 | $9,846 | $302,434 | $122,500 | $179,934 |
Source: Public Records
Map
Nearby Homes
- 227 S Benjamin Dr Unit B
- 227 S Benjamin Dr #B Unit B
- 701 Gary Ln Unit B
- 744 Bigler Ct Unit B
- 729 Tina Ct
- 722 Gary Ln Unit 460
- 256 N Benjamin Dr
- 740 B Tina Ct Unit B
- 739 Bigler Ct Unit A
- 742 Tina Ct Unit B
- 115 Tramway Dr Unit 2
- 115 Tramway Dr Unit 1
- 111 Tramway Dr Unit 5
- 111 Tramway Dr Unit 10
- 759 Boulder Ct Unit M
- 759 Boulder Ct Unit 6-G
- 245 Tramway Dr
- 259 Tramway Dr Unit 3
- 243 Tramway Dr
- 313 Tramway Dr Unit 10