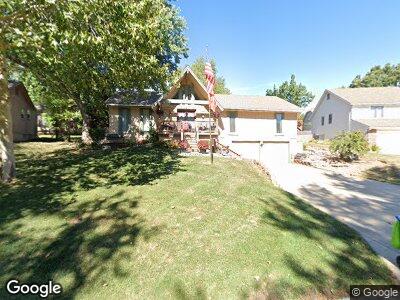
6562 Cottonwood Dr Shawnee, KS 66216
Estimated Value: $364,393 - $393,000
4
Beds
3
Baths
1,726
Sq Ft
$221/Sq Ft
Est. Value
About This Home
This home is located at 6562 Cottonwood Dr, Shawnee, KS 66216 and is currently estimated at $381,098, approximately $220 per square foot. 6562 Cottonwood Dr is a home located in Johnson County with nearby schools including Rhein Benninghoven Elementary School, Trailridge Middle School, and Shawnee Mission Northwest High School.
Ownership History
Date
Name
Owned For
Owner Type
Purchase Details
Closed on
Jan 30, 2025
Sold by
Hatfield Deborah S and Hatfield Curtis L
Bought by
Th Property Owner I Llc
Current Estimated Value
Purchase Details
Closed on
Feb 24, 2020
Sold by
Hatfield Deborah S and Hatfield Curtis L
Bought by
Hatfield Deborah S and Hatfield Curtis L
Home Financials for this Owner
Home Financials are based on the most recent Mortgage that was taken out on this home.
Original Mortgage
$161,400
Interest Rate
3.6%
Mortgage Type
New Conventional
Purchase Details
Closed on
May 2, 2002
Sold by
Davidson Deborah S and Hayden Sibyl A
Bought by
Davidson Deborah S
Home Financials for this Owner
Home Financials are based on the most recent Mortgage that was taken out on this home.
Original Mortgage
$160,800
Interest Rate
7.1%
Create a Home Valuation Report for This Property
The Home Valuation Report is an in-depth analysis detailing your home's value as well as a comparison with similar homes in the area
Home Values in the Area
Average Home Value in this Area
Purchase History
| Date | Buyer | Sale Price | Title Company |
|---|---|---|---|
| Th Property Owner I Llc | -- | None Listed On Document | |
| Hatfield Deborah S | -- | Clear Title | |
| Davidson Deborah S | -- | Realty Title Co |
Source: Public Records
Mortgage History
| Date | Status | Borrower | Loan Amount |
|---|---|---|---|
| Previous Owner | Hatfield Deborah S | $116,600 | |
| Previous Owner | Hatfield Curtis L | $49,600 | |
| Previous Owner | Hatfield Deborah S | $161,400 | |
| Previous Owner | Davidson Deborah S | $188,557 | |
| Previous Owner | Davidson Deborah S | $201,376 | |
| Previous Owner | Davidson Deborah S | $160,800 | |
| Closed | Davidson Deborah S | $30,000 |
Source: Public Records
Tax History Compared to Growth
Tax History
| Year | Tax Paid | Tax Assessment Tax Assessment Total Assessment is a certain percentage of the fair market value that is determined by local assessors to be the total taxable value of land and additions on the property. | Land | Improvement |
|---|---|---|---|---|
| 2024 | $3,829 | $36,271 | $6,622 | $29,649 |
| 2023 | $3,828 | $35,719 | $6,622 | $29,097 |
| 2022 | $3,347 | $31,130 | $5,753 | $25,377 |
| 2021 | $3,298 | $28,738 | $5,231 | $23,507 |
| 2020 | $3,101 | $26,657 | $4,753 | $21,904 |
| 2019 | $2,947 | $25,311 | $4,318 | $20,993 |
| 2018 | $2,735 | $23,391 | $4,318 | $19,073 |
| 2017 | $2,562 | $21,562 | $3,751 | $17,811 |
| 2016 | $2,470 | $20,516 | $3,751 | $16,765 |
| 2015 | $2,308 | $19,952 | $3,751 | $16,201 |
| 2013 | -- | $19,331 | $3,751 | $15,580 |
Source: Public Records
Map
Nearby Homes
- 6623 Cottonwood Dr
- 14309 W 64th St
- 6770 Widmer Rd
- 13708 W 69th Terrace
- 6935 Albervan St
- 6130 Albervan St
- 6203 Greenwood Dr
- 6150 Park St
- 6145 Park St
- 6143 Park St
- N/A Widmer Rd
- 6126 Park St
- 6106 Park St
- 7216 Rene St
- 6606 Rosehill Rd
- 4908 Noland Rd
- 15301 W 63rd St
- 14003 W 58th Place
- 5870 Park St Unit 2
- 5860 Park St Unit 4