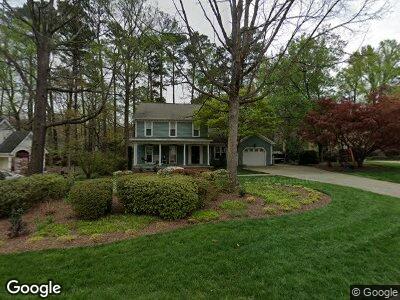
6608 Vancouver Ln Raleigh, NC 27615
Estimated Value: $530,000 - $613,000
3
Beds
3
Baths
1,970
Sq Ft
$287/Sq Ft
Est. Value
About This Home
This home is located at 6608 Vancouver Ln, Raleigh, NC 27615 and is currently estimated at $565,405, approximately $287 per square foot. 6608 Vancouver Ln is a home located in Wake County with nearby schools including North Ridge Elementary School, West Millbrook Middle School, and Sanderson High School.
Ownership History
Date
Name
Owned For
Owner Type
Purchase Details
Closed on
May 22, 2017
Sold by
Neisen Jeff L and Neisen Amy L
Bought by
Gardze Jason P and Gardze Jessica B
Current Estimated Value
Home Financials for this Owner
Home Financials are based on the most recent Mortgage that was taken out on this home.
Original Mortgage
$236,820
Interest Rate
4.1%
Mortgage Type
New Conventional
Purchase Details
Closed on
May 29, 2002
Sold by
Loverso Frank J and Loverso Mary Elizabeth
Bought by
Neisen Jeff L and Neisen Amy L
Home Financials for this Owner
Home Financials are based on the most recent Mortgage that was taken out on this home.
Original Mortgage
$177,175
Interest Rate
6.92%
Create a Home Valuation Report for This Property
The Home Valuation Report is an in-depth analysis detailing your home's value as well as a comparison with similar homes in the area
Home Values in the Area
Average Home Value in this Area
Purchase History
| Date | Buyer | Sale Price | Title Company |
|---|---|---|---|
| Gardze Jason P | $297,000 | None Available | |
| Neisen Jeff L | $186,500 | -- |
Source: Public Records
Mortgage History
| Date | Status | Borrower | Loan Amount |
|---|---|---|---|
| Open | Gardze Jason P | $316,000 | |
| Closed | Gardze Jason P | $30,000 | |
| Closed | Gardze Jason P | $236,820 | |
| Previous Owner | Neisen Jeff L | $148,000 | |
| Previous Owner | Neisen Jeff L | $163,500 | |
| Previous Owner | Neisen Jeff L | $157,200 | |
| Previous Owner | Neisen Jeff L | $15,000 | |
| Previous Owner | Loverso Frank Joseph | $180,337 | |
| Previous Owner | Neisen Jeff L | $177,175 | |
| Previous Owner | Loverso Frank Joseph | $28,500 | |
| Previous Owner | Loverso Frank Joseph | $141,000 |
Source: Public Records
Tax History Compared to Growth
Tax History
| Year | Tax Paid | Tax Assessment Tax Assessment Total Assessment is a certain percentage of the fair market value that is determined by local assessors to be the total taxable value of land and additions on the property. | Land | Improvement |
|---|---|---|---|---|
| 2024 | $4,279 | $529,817 | $165,000 | $364,817 |
| 2023 | $3,668 | $334,635 | $90,000 | $244,635 |
| 2022 | $3,408 | $334,635 | $90,000 | $244,635 |
| 2021 | $3,276 | $334,635 | $90,000 | $244,635 |
| 2020 | $3,216 | $334,635 | $90,000 | $244,635 |
| 2019 | $2,596 | $222,291 | $82,000 | $140,291 |
| 2018 | $2,449 | $222,291 | $82,000 | $140,291 |
| 2017 | $2,332 | $222,291 | $82,000 | $140,291 |
| 2016 | $2,285 | $222,291 | $82,000 | $140,291 |
| 2015 | $2,315 | $221,621 | $82,000 | $139,621 |
| 2014 | $2,196 | $221,621 | $82,000 | $139,621 |
Source: Public Records
Map
Nearby Homes
- 412 Lynchester Ct
- 6625 Arbor Grande Way
- 106 N Trail Dr
- 6216 Lewisand Cir
- 6750 Olde Province Ct
- 6909 Clear Sailing Ln
- 6734 Chauncey Dr
- 6804 Justice Dr
- 7126 Longstreet Dr Unit A
- 136 Ashton Hall Ln
- 7002 Longstreet Dr Unit C
- 7124 Longstreet Dr Unit B
- 7040 Longstreet Dr Unit C
- 7036 Longstreet Dr Unit B
- 7030 Longstreet Dr Unit A
- 6225 Tributary Dr
- 6221 Tributary Dr
- 5820 Shawood Dr
- 725 van Thomas Dr
- 6568 English Oaks Dr