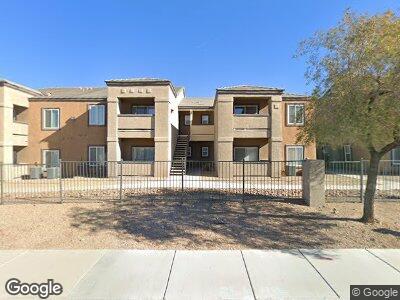
6650 W Warm Springs Rd Unit 1122 Las Vegas, NV 89118
Coronado Ranch NeighborhoodEstimated Value: $245,141 - $269,000
2
Beds
2
Baths
1,024
Sq Ft
$253/Sq Ft
Est. Value
About This Home
This home is located at 6650 W Warm Springs Rd Unit 1122, Las Vegas, NV 89118 and is currently estimated at $259,535, approximately $253 per square foot. 6650 W Warm Springs Rd Unit 1122 is a home located in Clark County with nearby schools including Tony Alamo Elementary School, Lawrence & Heidi Canarelli Middle School, and Sierra Vista High School.
Create a Home Valuation Report for This Property
The Home Valuation Report is an in-depth analysis detailing your home's value as well as a comparison with similar homes in the area
Home Values in the Area
Average Home Value in this Area
Tax History Compared to Growth
Tax History
| Year | Tax Paid | Tax Assessment Tax Assessment Total Assessment is a certain percentage of the fair market value that is determined by local assessors to be the total taxable value of land and additions on the property. | Land | Improvement |
|---|---|---|---|---|
| 2025 | $1,037 | $52,380 | $24,500 | $27,880 |
| 2024 | $1,037 | $52,380 | $24,500 | $27,880 |
| 2023 | $1,037 | $48,426 | $22,750 | $25,676 |
| 2022 | $957 | $43,661 | $19,950 | $23,711 |
| 2021 | $887 | $42,934 | $19,950 | $22,984 |
| 2020 | $820 | $41,079 | $18,200 | $22,879 |
| 2019 | $917 | $37,671 | $15,050 | $22,621 |
| 2018 | $734 | $36,323 | $15,050 | $21,273 |
| 2017 | $997 | $34,001 | $12,250 | $21,751 |
| 2016 | $688 | $27,859 | $5,775 | $22,084 |
| 2015 | $685 | $22,695 | $4,550 | $18,145 |
| 2014 | $664 | $21,967 | $4,550 | $17,417 |
Source: Public Records
Map
Nearby Homes
- 6650 W Warm Springs Rd Unit 1079
- 6516 Austin Hope Ave
- 7119 Steele Canyon St
- 6645 Churnet Valley Ave
- 6546 Churnet Valley Ave
- 7158 Black Sage St
- 7075 Jasper Hill Way
- 6686 Catoctin Ave
- 7452 Wine Creek St
- 7486 River Dove Ct
- 6785 Antique Oak Ct
- 7491 Speedwell Cavern St
- 6255 W Arby Ave Unit 118
- 6255 W Arby Ave Unit 295
- 6255 W Arby Ave Unit 183
- 6255 W Arby Ave Unit 193
- 6255 W Arby Ave Unit 258
- 7068 Parrot Bay Way
- 6655 Tranquil Seas Ct
- 7526 Gossamer Wind St